Kategorien in Thuringowa
Branchen
Unternehmensverteilung nach Branche in Thuringowa
| Branchenbeschreibung | Anzahl der Betriebe |
|---|---|
| Gesundheit und Medizin | 17 |
| Immobilien | 14 |
Thuringowa Facts
| Gebiet | 7.5 km² |
| Bevölkerung | 11.398 |
| Männliche Bevölkerung | 5.463 (47.9%) |
| Weibliche Bevölkerung | 5.935 (52.1%) |
| Population change (1975 to 2020) | +68.2% |
| Population change (2000 to 2020) | +29.8% |
| Mittleres Alter | 32.1 years (Male: 30.8, Female: 33.3) |
| Stadtviertel | Thuringowa Central, QLD |
| Zeit vor Ort | |
| Zeitzone | Ostaustralische Normalzeit |
| Geogr. Länge & Breite | -19.31669, 146.72893 |
Karte von Thuringowa
Interaktive Karte
Bevölkerung von Thuringowa
Jahre 1975 bis 2030
| Data | 1975 | 1990 | 2000 | 2015 | 2020 | 2025* | 2030* |
|---|---|---|---|---|---|---|---|
| Bevölkerung | 6.778 | 7.855 | 8.780 | 11.100 | 11.398 | 11.835 | 12.352 |
| Bevölkerungsdichte | 903,7 / km² | 1.047,3 / km² | 1.170,7 / km² | 1.480 / km² | 1.519,7 / km² | 1.578 / km² | 1.646,9 / km² |
Bevölkerungsänderung in Thuringowa von 2000 bis 2020
Anstieg um 29.8 % von 2000 bis 2020
| Standort | Änderung seit 1975 | Änderung seit 1990 | Änderung seit 2000 |
|---|---|---|---|
| Thuringowa | +68.2% | +45.1% | +29.8% |
| Queensland | — | — | — |
| Australien | — | — | — |
Medianalter von Thuringowa
Medianalter: 32.1 Jahre
| Standort | Mittleres Alter | Durchschnittsalter (weiblich) | Durchschnittsalter (männlich) |
|---|---|---|---|
| Thuringowa | 32.1 yrs | 33.3 yrs | 30.8 yrs |
| Queensland | 36.8 yrs | 37.5 yrs | 36.1 yrs |
| Australien | 37.7 yrs | 38.6 yrs | 36.8 yrs |
Bevölkerungsdichte von Thuringowa
Bevölkerungsdichte: 1.520 / km²
| Standort | Bevölkerung | Gebiet | Dichte |
|---|---|---|---|
| Thuringowa | 11.398 | 7,5 km² | 1.520 / km² |
| Queensland | 4,8 million | 1.730.083,5 km² | 2,7 / km² |
| Australien | 23,8 million | 7.690.961,5 km² | 3,1 / km² |
Historische und prognostizierte Bevölkerung von Thuringowa
Geschätzte Bevölkerung von 1870 bis 2100
- JRC (Gemeinsame Forschungsstelle der Europäischen Kommission) arbeitet an GHS built-up grid
- CIESIN (Center for International Earth Science Information Network)
- [Verknüpfung] Klein Goldewijk, K., Beusen, A., Doelman, J., and Stehfest, E.: Anthropogenic land use estimates for the Holocene – HYDE 3.2, Earth Syst. Sci. Data, 9, 927–953, https://doi.org/10.5194/essd-9-927-2017, 2017.
Price Distribution
Geschäftsverteilung nach Preis für Thuringowa
Human Development Index (HDI)
Statistischer zusammengesetzter Index der Lebenserwartung, der Bildung und des Pro-Kopf-Einkommens.
CO2-Emissionen von Thuringowa
Kohlendioxid (CO2) -Emissionen pro Kopf in Tonnen pro Jahr
| Standort | CO2-Emissionen | CO2-Emissionen pro Kopf | Intensität der CO2-Emissionen |
|---|---|---|---|
| Thuringowa | 204,019 tn | 17.9 tn | 27,202.6 tons/km² |
| Queensland | 83,884,578 tn | 17.64 tn | 48.5 tons/km² |
| Australien | 401,155,564 tn | 16.88 tn | 52.2 tons/km² |
| CO2-Emissionen 2013 (Tonnen/Jahr) | 204,019 tn |
| CO2-Emissionen 2013 (Tonnen/Jahr) pro Kopf | 17.9 tn |
| CO2-Emissionsintensität 2013 (Tonnen/km²/Jahr) | 27,202.6 tons/km² |
Naturgefahrenrisiko
Relatives Risiko von 10
| Gefahr | Risikostufe |
|---|---|
| Dürre | Hoch (9) |
| Flut | Mittel (4) |
| Erdbeben | Mittel (4) |
| Zyklon | Mittel (5) |
* Das Risiko, insbesondere in Bezug auf Überschwemmungen oder Erdrutsche, gilt möglicherweise nicht für das gesamte Gebiet.
- Dilley, M., R.S. Chen, U. Deichmann, A.L. Lerner-Lam, M. Arnold, J. Agwe, P. Buys, O. Kjekstad, B. Lyon, and G. Yetman. 2005. Natural Disaster Hotspots: A Global Risk Analysis. Washington, D.C.: World Bank. https://doi.org/10.1596/0-8213-5930-4.
- Center for Hazards and Risk Research - CHRR - Columbia University, Center for International Earth Science Information Network - CIESIN - Columbia University, International Bank for Reconstruction and Development - The World Bank, and United Nations Environment Programme Global Resource Information Database Geneva - UNEP/GRID-Geneva. 2005. Global Cyclone Hazard Frequency and Distribution. Palisades, NY: NASA Socioeconomic Data and Applications Center (SEDAC). https://doi.org/10.7927/H4CZ353K.
- Center for Hazards and Risk Research - CHRR - Columbia University, Center for International Earth Science Information Network - CIESIN - Columbia University, and International Research Institute for Climate and Society - IRI - Columbia University. 2005. Global Drought Hazard Frequency and Distribution. Palisades, NY: NASA Socioeconomic Data and Applications Center (SEDAC). https://doi.org/10.7927/H4VX0DFT.
- Center for Hazards and Risk Research - CHRR - Columbia University, Center for International Earth Science Information Network - CIESIN - Columbia University. 2005. Global Flood Hazard Frequency and Distribution. Palisades, NY: NASA Socioeconomic Data and Applications Center (SEDAC). https://doi.org/10.7927/H4668B3D.
- Center for Hazards and Risk Research - CHRR - Columbia University, Center for International Earth Science Information Network - CIESIN - Columbia University. 2005. Global Earthquake Hazard Distribution - Peak Ground Acceleration. Palisades, NY: NASA Socioeconomic Data and Applications Center (SEDAC). https://doi.org/10.7927/H4BZ63ZS.
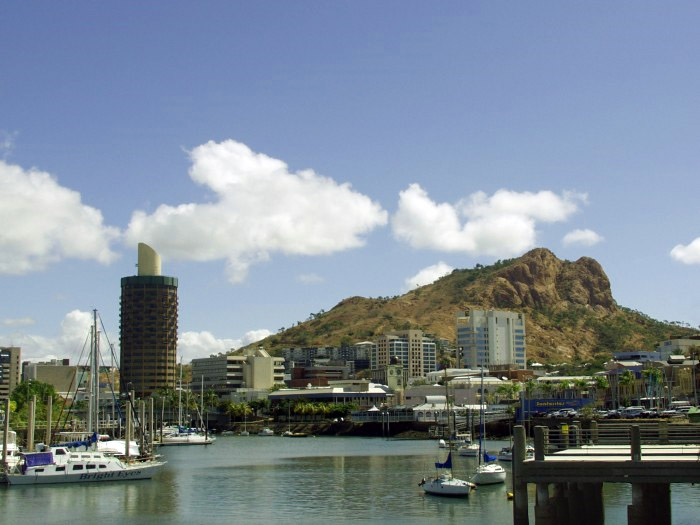
Thuringowa
Thuringowa ist eine australische Stadt mit etwa 59.000 Einwohnern. Sie liegt im nördlichen Queensland unmittelbar westlich und oberhalb der Küstenstadt Townsville. Beide Städte zusammen haben eine Einwohnerzahl von etwa 155.000 (Stand 2004). Sie befinden sich ..
Thuringowa Wikipedia-Seite


Über unsere Daten
Die Daten auf dieser Seite werden anhand verschiedener öffentlich zugänglicher Werkzeuge und Quellen geschätzt. Sie werden ohne Gewähr bereitgestellt und können Ungenauigkeiten enthalten. Nutzung auf eigene Gefahr.