Kategorien in Indaiatuba
Branchen
Unternehmensverteilung nach Branche in Indaiatuba
| Branchenbeschreibung | Anzahl der Betriebe | Durchschnittsalter des Geschäfts |
|---|---|---|
| Einkaufen | 2,400 | 26 years |
| Restaurants | 1,597 | 26 years |
| Bekleidungsladen | 1,134 | 26 years |
| Immobilien | 1,089 | 22 years |
| Unternehmensleitung | 1,078 | 28 years |
| Autoreparatur | 924 | 27 years |
| Shopping Sonstige | 789 | 29 years |
| Schönheitssalon | 780 | 19 years |
| Elektronikläden | 760 | 22 years |
| Lebensmittelläden und Supermärkte | 540 | 29 years |
| Bars, Kneipen und Wirtshäuser | 538 | 22 years |
| Großhandel im Bauzubehör | 511 | 38 years |
| Alle Lebensmittel und Getränke | 488 | 30 years |
| Baumarkt | 477 | 26 years |
| Apotheken und Drogerien | 473 | 27 years |
| Maschinengroßhandel | 469 | 26 years |
| Erziehung und Unterricht | 461 | 29 years |
Indaiatuba Facts
| Gebiet | 194.9 km² |
| Bevölkerung | 232.262 |
| Männliche Bevölkerung | 115.294 (49.6%) |
| Weibliche Bevölkerung | 116.968 (50.4%) |
| Population change (1975 to 2020) | +336.5% |
| Population change (2000 to 2020) | +54.7% |
| Mittleres Alter | 31.1 years (Male: 30.4, Female: 31.8) |
| BIP pro Kopf (KKP) | $19.448 (2022) |
| Stadtviertel | Centro, Jardim Morada do Sol, Cidade Nova I, Recreio Campestre Jóia, Jardim Tropical |
| Zeit vor Ort | |
| Zeitzone | Brasília-Normalzeit |
| Geogr. Länge & Breite | -23.08842, -47.21190 |
| Postleitzahlen | 13330, 13331, 13332, 13333, 13334, More |
Karte von Indaiatuba
Interaktive Karte
Bevölkerung von Indaiatuba
Jahre 1975 bis 2030
| Data | 1975 | 1990 | 2000 | 2015 | 2020 | 2025* | 2030* |
|---|---|---|---|---|---|---|---|
| Bevölkerung | 53.209 | 103.834 | 150.143 | 238.692 | 232.262 | 236.933 | 242.270 |
| Bevölkerungsdichte | 273 / km² | 532,7 / km² | 770,2 / km² | 1.224,5 / km² | 1.191,5 / km² | 1.215,4 / km² | 1.242,8 / km² |
Bevölkerungsänderung in Indaiatuba von 2000 bis 2020
Anstieg um 54.7 % von 2000 bis 2020
| Standort | Änderung seit 1975 | Änderung seit 1990 | Änderung seit 2000 |
|---|---|---|---|
| Indaiatuba | +336.5% | +123.7% | +54.7% |
| São Paulo (Bundesstaat) | — | — | — |
| Brasilien | — | — | — |
Medianalter von Indaiatuba
Medianalter: 31.1 Jahre
| Standort | Mittleres Alter | Durchschnittsalter (weiblich) | Durchschnittsalter (männlich) |
|---|---|---|---|
| Indaiatuba | 31.1 yrs | 31.8 yrs | 30.4 yrs |
| São Paulo (Bundesstaat) | 31.5 yrs | 32.4 yrs | 30.4 yrs |
| Brasilien | 29.5 yrs | 30.3 yrs | 28.7 yrs |
Bevölkerungsdichte von Indaiatuba
Bevölkerungsdichte: 1.192 / km²
| Standort | Bevölkerung | Gebiet | Dichte |
|---|---|---|---|
| Indaiatuba | 232.262 | 194,9 km² | 1.192 / km² |
| São Paulo (Bundesstaat) | 44,6 million | 248.223,6 km² | 180 / km² |
| Brasilien | 206,1 million | 8.479.487,1 km² | 24,3 / km² |
Historische und prognostizierte Bevölkerung von Indaiatuba
Geschätzte Bevölkerung von 1900 bis 2100
- JRC (Gemeinsame Forschungsstelle der Europäischen Kommission) arbeitet an GHS built-up grid
- CIESIN (Center for International Earth Science Information Network)
- [Verknüpfung] Klein Goldewijk, K., Beusen, A., Doelman, J., and Stehfest, E.: Anthropogenic land use estimates for the Holocene – HYDE 3.2, Earth Syst. Sci. Data, 9, 927–953, https://doi.org/10.5194/essd-9-927-2017, 2017.
Stadtteile in Indaiatuba
Prozentsatz der Unternehmen nach Stadtteil in Indaiatuba
Postleitzahlen
Prozentsatz der Unternehmen nach Postleitzahl in Indaiatuba
Price Distribution
Geschäftsverteilung nach Preis für Indaiatuba
Human Development Index (HDI)
Statistischer zusammengesetzter Index der Lebenserwartung, der Bildung und des Pro-Kopf-Einkommens.
Bruttoinlandsprodukt (BIP) von Indaiatuba
BIP pro Kopf, KKP (konstante internationale $ von 2017)
| Data | 1990 | 1995 | 2000 | 2005 | 2010 | 2015 | 2020 | 2022 |
|---|---|---|---|---|---|---|---|---|
| BIP pro Kopf | $13.986 | $15.007 | $15.380 | $16.537 | $18.015 | $17.918 | $17.868 | $19.448 |
| BIP insgesamt | $1,6 Mrd. | $1,9 Mrd. | $2,2 Mrd. | $2,8 Mrd. | $3,6 Mrd. | $3,9 Mrd. | $4 Mrd. | $4,4 Mrd. |
CO2-Emissionen von Indaiatuba
Kohlendioxid (CO2) -Emissionen pro Kopf in Tonnen pro Jahr
| Standort | CO2-Emissionen | CO2-Emissionen pro Kopf | Intensität der CO2-Emissionen |
|---|---|---|---|
| Indaiatuba | 1,049,179 tn | 4.52 tn | 5,382.1 tons/km² |
| São Paulo (Bundesstaat) | 156,280,136 tn | 3.51 tn | 629.6 tons/km² |
| Brasilien | 561,829,904 tn | 2.73 tn | 66.3 tons/km² |
| CO2-Emissionen 2013 (Tonnen/Jahr) | 1,049,179 tn |
| CO2-Emissionen 2013 (Tonnen/Jahr) pro Kopf | 4.52 tn |
| CO2-Emissionsintensität 2013 (Tonnen/km²/Jahr) | 5,382.1 tons/km² |
Naturgefahrenrisiko
Relatives Risiko von 10
| Gefahr | Risikostufe |
|---|---|
| Flut | Hoch (10) |
* Das Risiko, insbesondere in Bezug auf Überschwemmungen oder Erdrutsche, gilt möglicherweise nicht für das gesamte Gebiet.
- Dilley, M., R.S. Chen, U. Deichmann, A.L. Lerner-Lam, M. Arnold, J. Agwe, P. Buys, O. Kjekstad, B. Lyon, and G. Yetman. 2005. Natural Disaster Hotspots: A Global Risk Analysis. Washington, D.C.: World Bank. https://doi.org/10.1596/0-8213-5930-4.
- Center for Hazards and Risk Research - CHRR - Columbia University, Center for International Earth Science Information Network - CIESIN - Columbia University. 2005. Global Flood Hazard Frequency and Distribution. Palisades, NY: NASA Socioeconomic Data and Applications Center (SEDAC). https://doi.org/10.7927/H4668B3D.
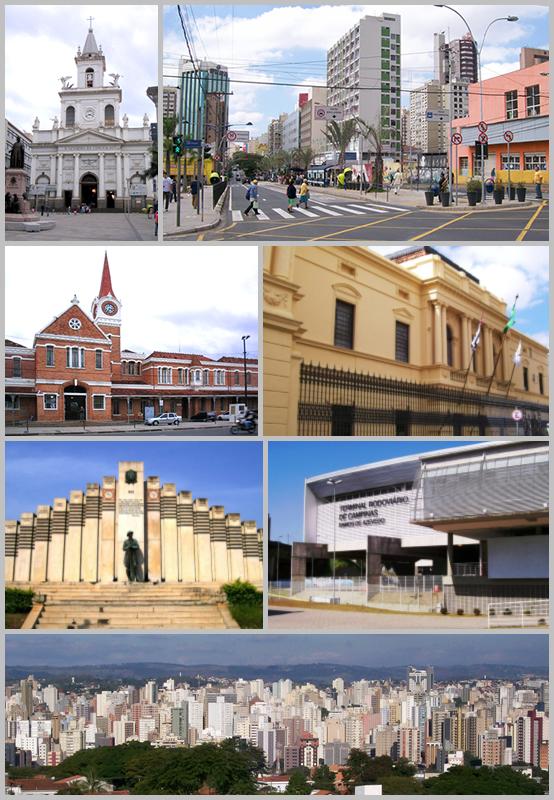
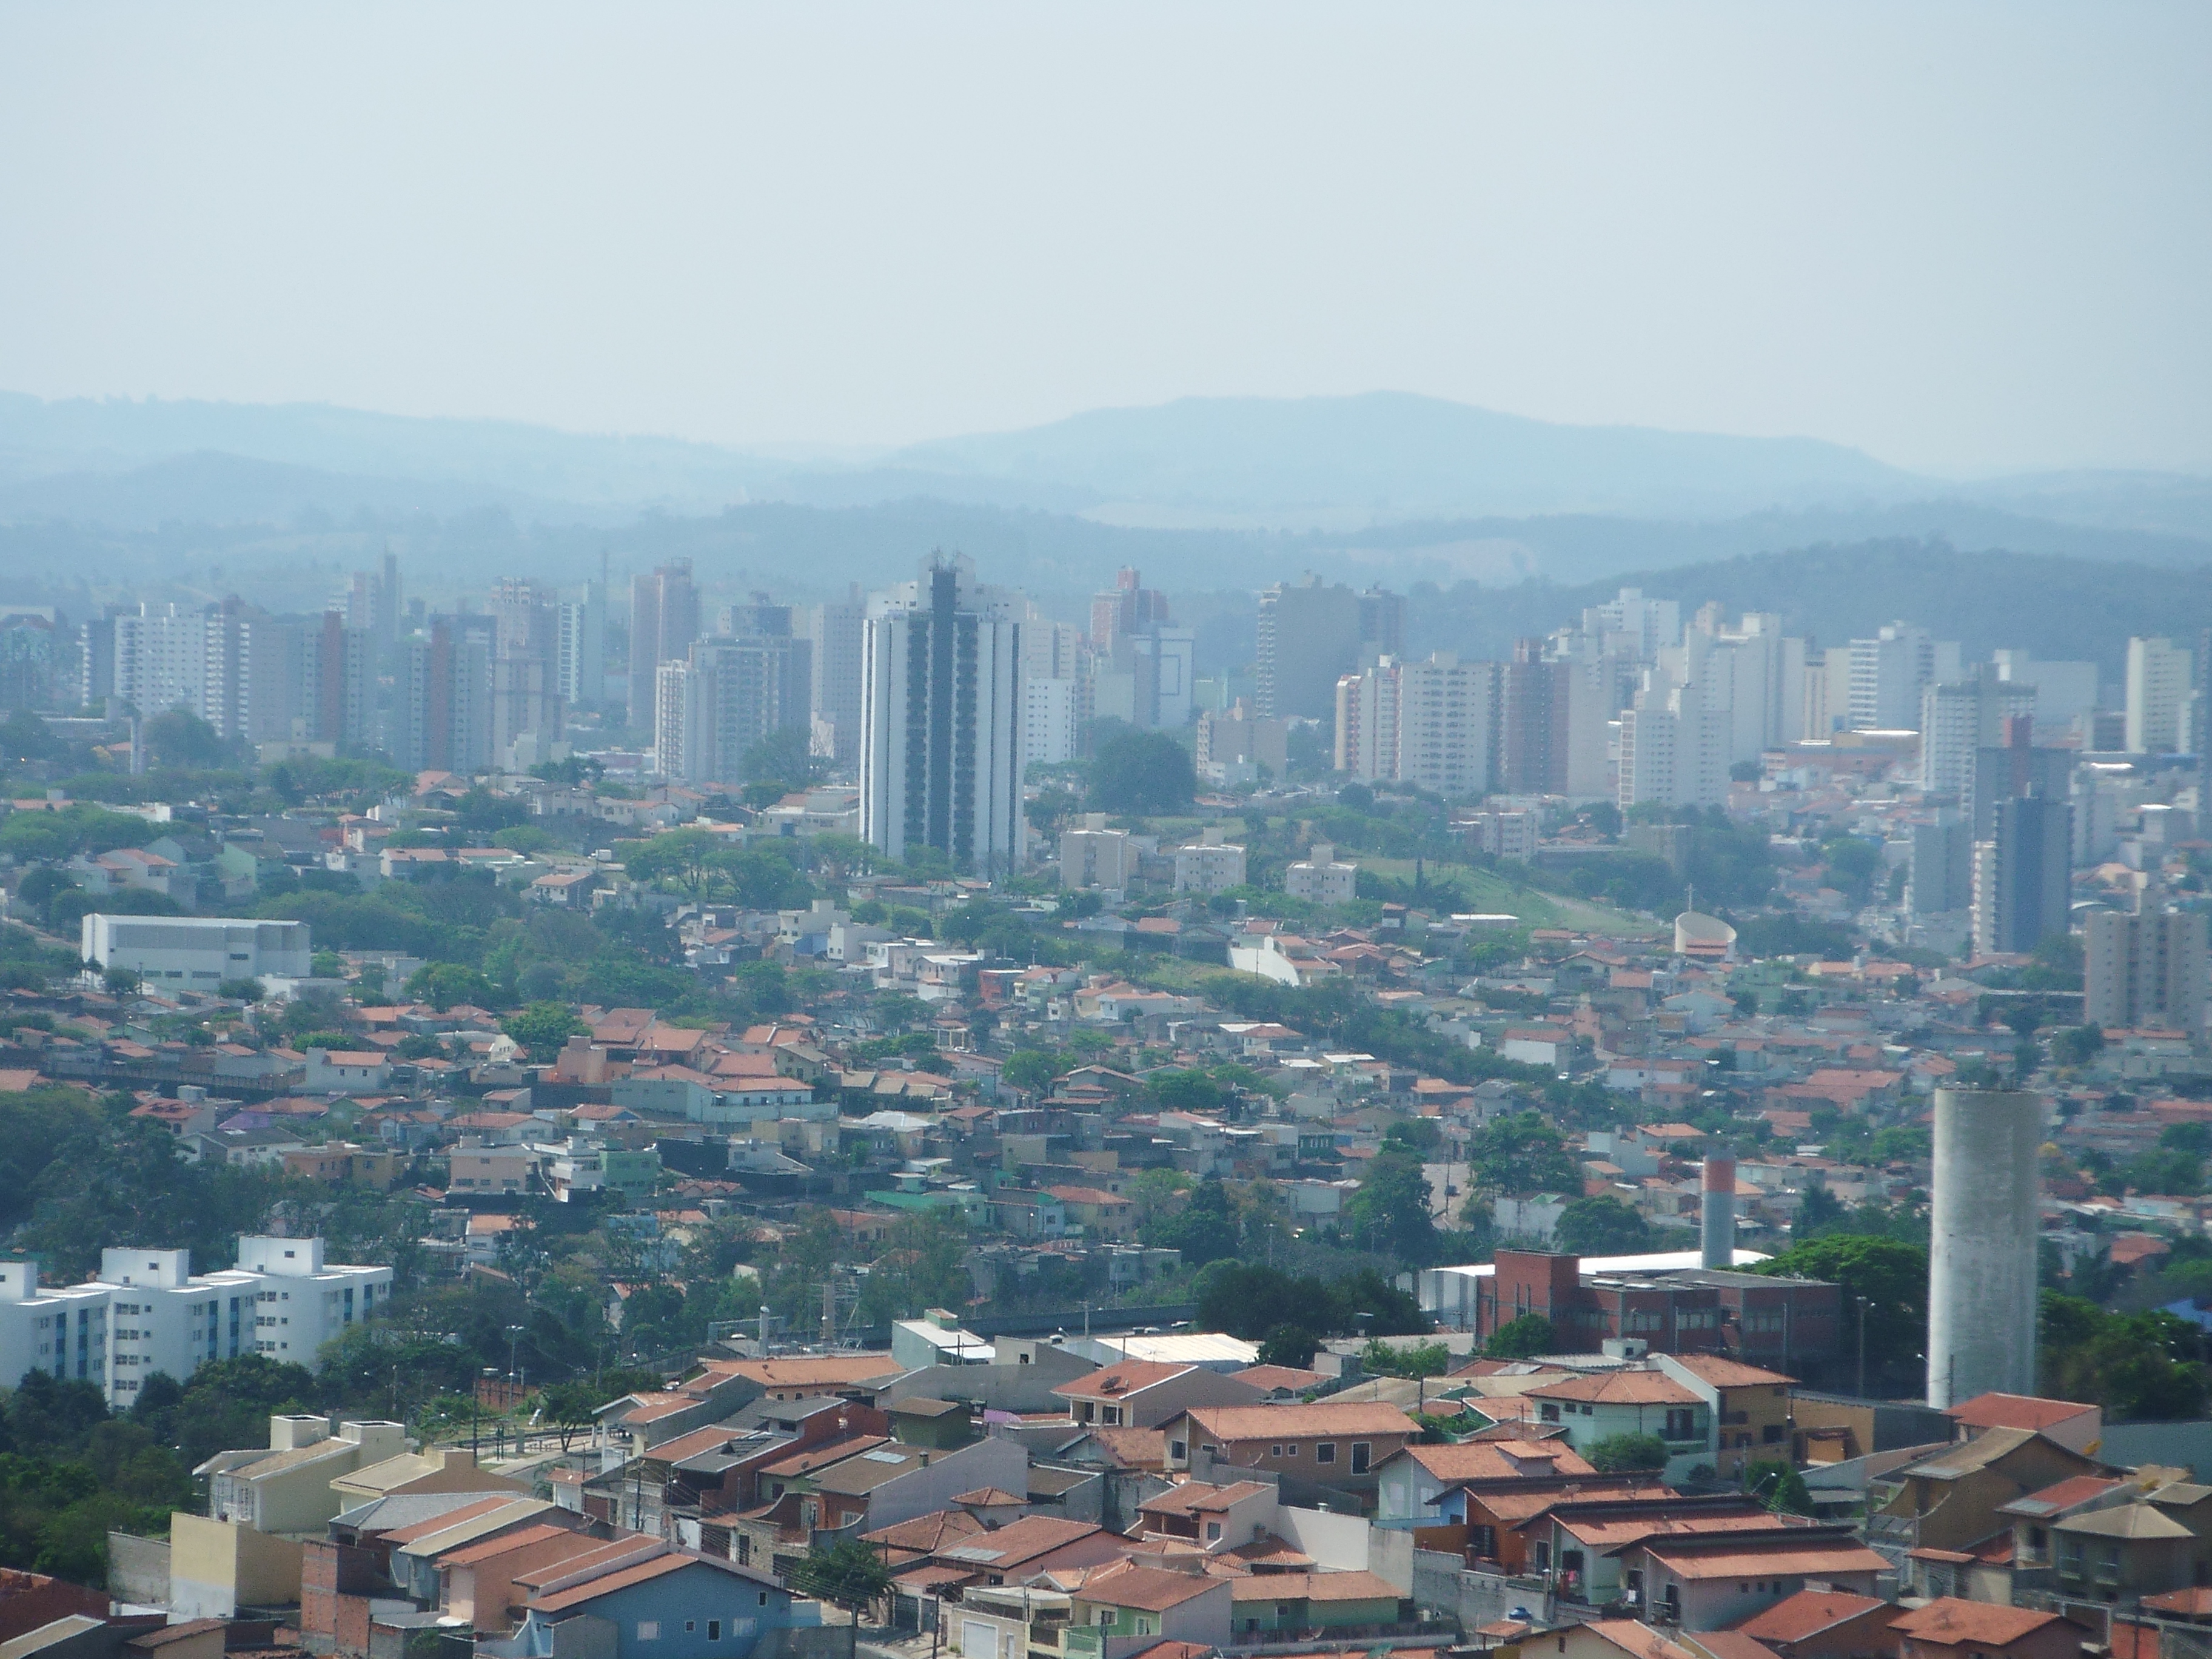
Indaiatuba
Indaiatuba ist eine Stadt im Landesinneren des brasilianischen Bundesstaates São Paulo mit 205.808 Einwohnern (2011). Stadt hat ihren Namen von Indaiá. In der Sprache der Ureinwohner der Region (Tupí-Guaraní) bezeichnet Indaiá die Palmenart Attalea dubia. Das..
Indaiatuba Wikipedia-Seite

Über unsere Daten
Die Daten auf dieser Seite werden anhand verschiedener öffentlich zugänglicher Werkzeuge und Quellen geschätzt. Sie werden ohne Gewähr bereitgestellt und können Ungenauigkeiten enthalten. Nutzung auf eigene Gefahr.