Kategorien in Corozal (Belize)
Branchen
Unternehmensverteilung nach Branche in Corozal (Belize)
| Branchenbeschreibung | Anzahl der Betriebe |
|---|---|
| Restaurants | 91 |
| Lebensmittelläden und Supermärkte | 39 |
| Einkaufen | 30 |
| Sonstige Beherbergungsstätten | 23 |
| Bekleidungsladen | 21 |
| Kirchen | 20 |
| Fastfood Restaurants | 19 |
| Öffentliche Parkanlagen | 15 |
| Autoreparatur | 15 |
| Apotheken und Drogerien | 14 |
| Bäckereien | 14 |
| Car Wash und Detail | 13 |
| Immobilien | 12 |
| Gesundheit und Medizin | 11 |
| Cafés | 11 |
Corozal (Belize) Facts
| Gebiet | 1627.8 km² |
| Bevölkerung | 30.591 |
| Männliche Bevölkerung | 15.303 (50.0%) |
| Weibliche Bevölkerung | 15.288 (50.0%) |
| Population change (1975 to 2020) | +85.9% |
| Population change (2000 to 2020) | +26.7% |
| Mittleres Alter | 22.6 years (Male: 22.7, Female: 22.6) |
| BIP pro Kopf (KKP) | $13.014 (2022) |
| Vorwahlen | 4 |
| Zeit vor Ort | |
| Zeitzone | Nordamerikanische Zentral-Normalzeit |
| Geogr. Länge & Breite | 18.39375, -88.38849 |
Karte von Corozal (Belize)
Interaktive Karte
Bevölkerung von Corozal (Belize)
Jahre 1975 bis 2030
| Data | 1975 | 1990 | 2000 | 2015 | 2020 | 2025* | 2030* |
|---|---|---|---|---|---|---|---|
| Bevölkerung | 16.456 | 20.134 | 24.140 | 30.696 | 30.591 | 31.899 | 33.157 |
| Bevölkerungsdichte | 10,1 / km² | 12,4 / km² | 14,8 / km² | 18,9 / km² | 18,8 / km² | 19,6 / km² | 20,4 / km² |
Bevölkerungsänderung in Corozal (Belize) von 2000 bis 2020
Anstieg um 26.7 % von 2000 bis 2020
| Standort | Änderung seit 1975 | Änderung seit 1990 | Änderung seit 2000 |
|---|---|---|---|
| Corozal (Belize) | +85.9% | +51.9% | +26.7% |
| Corozal District | — | — | — |
| Belize | — | — | — |
Medianalter von Corozal (Belize)
Medianalter: 22.6 Jahre
| Standort | Mittleres Alter | Durchschnittsalter (weiblich) | Durchschnittsalter (männlich) |
|---|---|---|---|
| Corozal (Belize) | 22.6 yrs | 22.6 yrs | 22.7 yrs |
| Corozal District | 22.6 yrs | 22.6 yrs | 22.7 yrs |
| Belize | 22 yrs | 22.1 yrs | 21.8 yrs |
Bevölkerungsdichte von Corozal (Belize)
Bevölkerungsdichte: 18,8 / km²
| Standort | Bevölkerung | Gebiet | Dichte |
|---|---|---|---|
| Corozal (Belize) | 30.591 | 1.627,8 km² | 18,8 / km² |
| Corozal District | 44.687 | 1.973,7 km² | 22,6 / km² |
| Belize | 349.968 | 22.282,9 km² | 15,7 / km² |
Historische und prognostizierte Bevölkerung von Corozal (Belize)
Geschätzte Bevölkerung von 600 bis 2100
- JRC (Gemeinsame Forschungsstelle der Europäischen Kommission) arbeitet an GHS built-up grid
- CIESIN (Center for International Earth Science Information Network)
- [Verknüpfung] Klein Goldewijk, K., Beusen, A., Doelman, J., and Stehfest, E.: Anthropogenic land use estimates for the Holocene – HYDE 3.2, Earth Syst. Sci. Data, 9, 927–953, https://doi.org/10.5194/essd-9-927-2017, 2017.
Vorwahlen
Prozentuale Vorwahlen, die von Unternehmen in Corozal (Belize) verwendet werden
Price Distribution
Geschäftsverteilung nach Preis für Corozal (Belize)
Human Development Index (HDI)
Statistischer zusammengesetzter Index der Lebenserwartung, der Bildung und des Pro-Kopf-Einkommens.
Bruttoinlandsprodukt (BIP) von Corozal (Belize)
BIP pro Kopf, KKP (konstante internationale $ von 2017)
| Data | 1990 | 1995 | 2000 | 2005 | 2010 | 2015 | 2020 | 2022 |
|---|---|---|---|---|---|---|---|---|
| BIP pro Kopf | $8.463 | $7.681 | $12.831 | $15.716 | $14.549 | $15.770 | $11.140 | $13.014 |
| BIP insgesamt | $179 Mio. | $180,4 Mio. | $335,8 Mio. | $463,8 Mio. | $476,9 Mio. | $555,9 Mio. | $388 Mio. | $461,4 Mio. |
CO2-Emissionen von Corozal (Belize)
Kohlendioxid (CO2) -Emissionen pro Kopf in Tonnen pro Jahr
| Standort | CO2-Emissionen | CO2-Emissionen pro Kopf | Intensität der CO2-Emissionen |
|---|---|---|---|
| Corozal (Belize) | 82,924 tn | 2.71 tn | 50.9 tons/km² |
| Corozal District | 121,148 tn | 2.71 tn | 61.4 tons/km² |
| Belize | 920,961 tn | 2.63 tn | 41.3 tons/km² |
| CO2-Emissionen 2013 (Tonnen/Jahr) | 82,924 tn |
| CO2-Emissionen 2013 (Tonnen/Jahr) pro Kopf | 2.71 tn |
| CO2-Emissionsintensität 2013 (Tonnen/km²/Jahr) | 50.9 tons/km² |
Naturgefahrenrisiko
Relatives Risiko von 10
| Gefahr | Risikostufe |
|---|---|
| Flut | Mittel (7) |
| Erdbeben | Niedrig (2.2) |
| Zyklon | Hoch (9) |
* Das Risiko, insbesondere in Bezug auf Überschwemmungen oder Erdrutsche, gilt möglicherweise nicht für das gesamte Gebiet.
- Dilley, M., R.S. Chen, U. Deichmann, A.L. Lerner-Lam, M. Arnold, J. Agwe, P. Buys, O. Kjekstad, B. Lyon, and G. Yetman. 2005. Natural Disaster Hotspots: A Global Risk Analysis. Washington, D.C.: World Bank. https://doi.org/10.1596/0-8213-5930-4.
- Center for Hazards and Risk Research - CHRR - Columbia University, Center for International Earth Science Information Network - CIESIN - Columbia University, International Bank for Reconstruction and Development - The World Bank, and United Nations Environment Programme Global Resource Information Database Geneva - UNEP/GRID-Geneva. 2005. Global Cyclone Hazard Frequency and Distribution. Palisades, NY: NASA Socioeconomic Data and Applications Center (SEDAC). https://doi.org/10.7927/H4CZ353K.
- Center for Hazards and Risk Research - CHRR - Columbia University, Center for International Earth Science Information Network - CIESIN - Columbia University. 2005. Global Flood Hazard Frequency and Distribution. Palisades, NY: NASA Socioeconomic Data and Applications Center (SEDAC). https://doi.org/10.7927/H4668B3D.
- Center for Hazards and Risk Research - CHRR - Columbia University, Center for International Earth Science Information Network - CIESIN - Columbia University. 2005. Global Earthquake Hazard Distribution - Peak Ground Acceleration. Palisades, NY: NASA Socioeconomic Data and Applications Center (SEDAC). https://doi.org/10.7927/H4BZ63ZS.
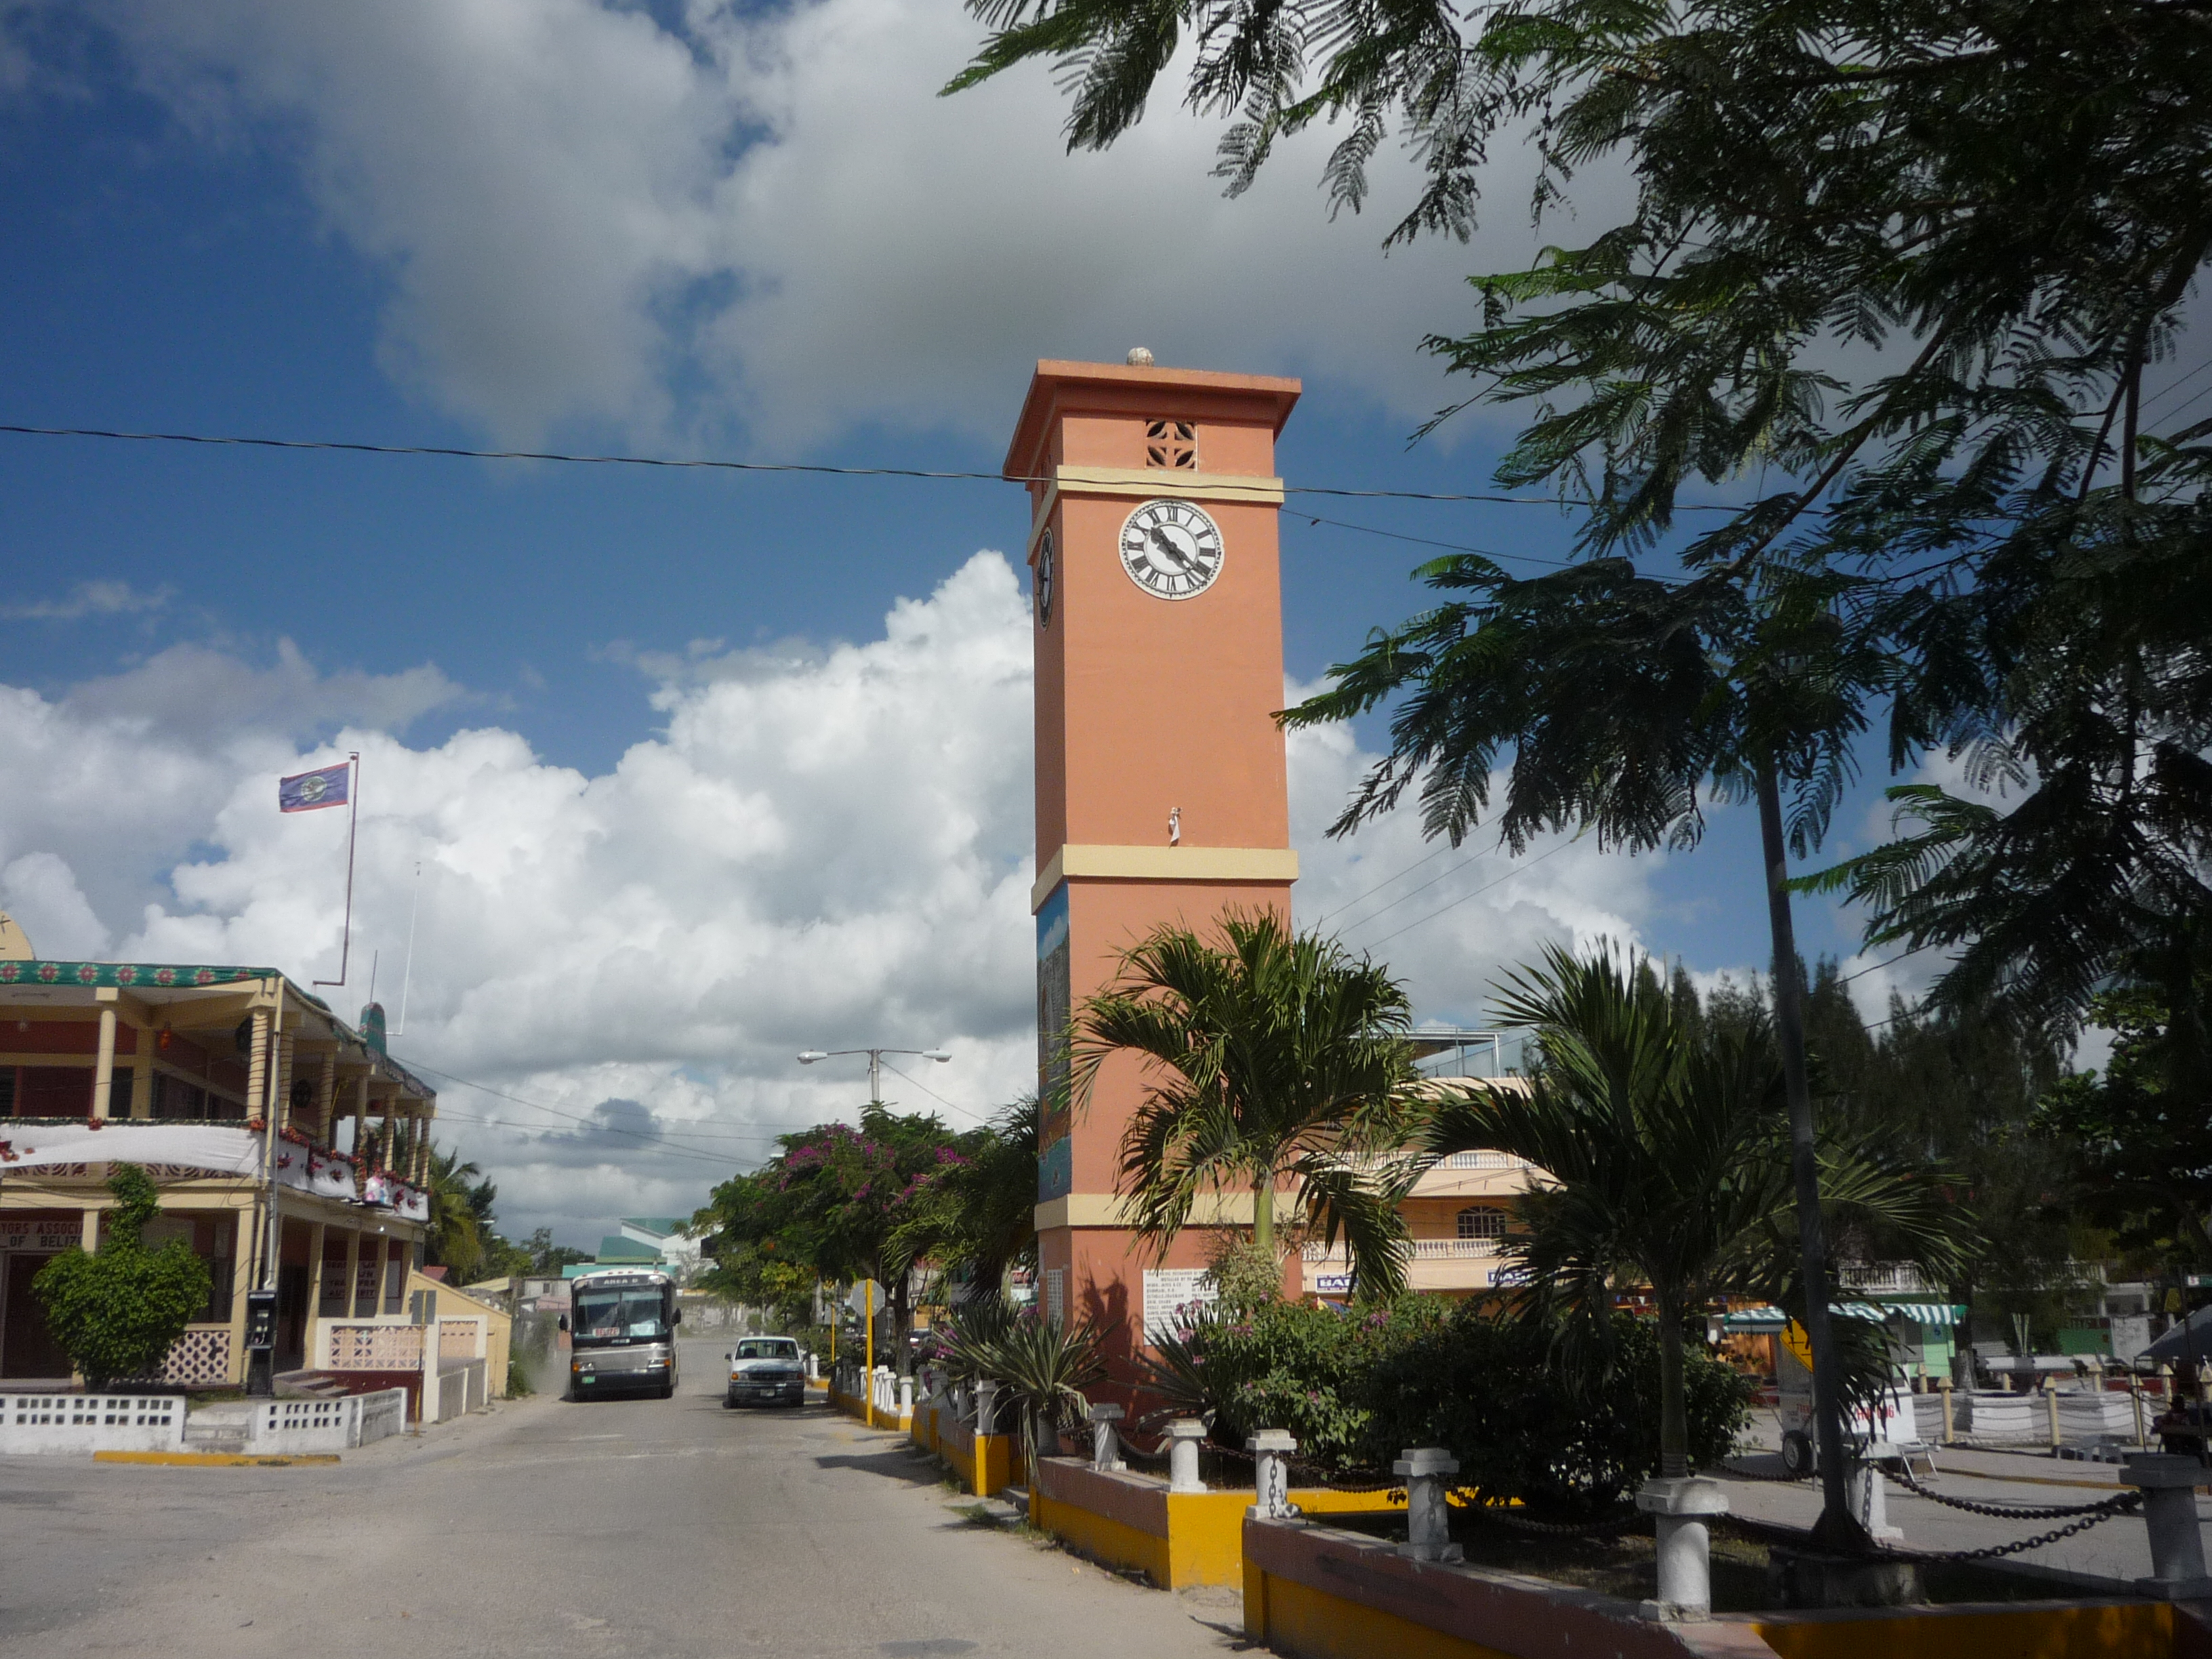
Corozal (Belize)
(zur Unterscheidung vom gleichnamigen Distrikt auch Corozal Town) ist eine Kleinstadt im mittelamerikanischen Belize an der Grenze zu Mexiko. Stadt hat rund 9.800 Einwohner (Stand 2010) und ist die Hauptstadt der Provinz Corozal District. Corozal Town wurde..
Corozal (Belize) Wikipedia-Seite")


Über unsere Daten
Die Daten auf dieser Seite werden anhand verschiedener öffentlich zugänglicher Werkzeuge und Quellen geschätzt. Sie werden ohne Gewähr bereitgestellt und können Ungenauigkeiten enthalten. Nutzung auf eigene Gefahr.