Kategorien in St. Moritz
Branchen
Unternehmensverteilung nach Branche in St. Moritz
| Branchenbeschreibung | Anzahl der Betriebe | Durchschnittsalter des Geschäfts |
|---|---|---|
| Restaurants | 95 | 29 years |
| Immobilien | 88 | 54 years |
| Shopping Sonstige | 66 | — |
| Sonstige Beherbergungsstätten | 64 | 102 years |
| Einkaufen | 61 | 43 years |
| Bekleidungsladen | 52 | — |
| Hotels und Motels | 44 | — |
| Unternehmensleitung | 44 | 27 years |
| Hochbau | 35 | — |
| Bars, Kneipen und Wirtshäuser | 30 | — |
| Gesundheit und Medizin | 24 | — |
St. Moritz Facts
| Gebiet | 2.3 km² |
| Bevölkerung | 3.028 |
| Männliche Bevölkerung | 1.638 (54.1%) |
| Weibliche Bevölkerung | 1.390 (45.9%) |
| Population change (1975 to 2020) | +6.1% |
| Population change (2000 to 2020) | +7.8% |
| Mittleres Alter | 38.9 years (Male: 37.7, Female: 40.6) |
| Vorwahlen | 81 |
| Stadtviertel | Vicosoprano, Sankt Moritz-Bad |
| Zeit vor Ort | |
| Zeitzone | Mitteleuropäische Sommerzeit |
| Geogr. Länge & Breite | 46.49840, 9.83909 |
Karte von St. Moritz
Interaktive Karte
Bevölkerung von St. Moritz
Jahre 1975 bis 2020
| Data | 1975 | 1990 | 2000 | 2015 | 2020 |
|---|---|---|---|---|---|
| Bevölkerung | 2.853 | 2.897 | 2.808 | 3.008 | 3.028 |
| Bevölkerungsdichte | 1.268 / km² | 1.287,6 / km² | 1.248 / km² | 1.336,9 / km² | 1.345,8 / km² |
Bevölkerungsänderung in St. Moritz von 2000 bis 2015
Anstieg um 7.1 % von 2000 bis 2015
| Standort | Änderung seit 1975 | Änderung seit 1990 | Änderung seit 2000 |
|---|---|---|---|
| St. Moritz | +5.4% | +3.8% | +7.1% |
| Kanton Graubünden | +7.3% | +10% | +7.6% |
| Schweiz | +30.6% | +24.4% | +15.8% |
Medianalter von St. Moritz
Medianalter: 38.9 Jahre
| Standort | Mittleres Alter | Durchschnittsalter (weiblich) | Durchschnittsalter (männlich) |
|---|---|---|---|
| St. Moritz | 38.9 yrs | 40.6 yrs | 37.7 yrs |
| Kanton Graubünden | 42 yrs | 43 yrs | 41.1 yrs |
| Schweiz | 41.4 yrs | 42.3 yrs | 40.5 yrs |
Bevölkerungsdichte von St. Moritz
Bevölkerungsdichte: 1.346 / km²
| Standort | Bevölkerung | Gebiet | Dichte |
|---|---|---|---|
| St. Moritz | 3.028 | 2,25 km² | 1.346 / km² |
| Kanton Graubünden | 205.163 | 7.105,1 km² | 28,9 / km² |
| Schweiz | 8,3 million | 41.281,4 km² | 200 / km² |
Historische und prognostizierte Bevölkerung von St. Moritz
Geschätzte Bevölkerung von 1100 bis 2100
- JRC (Gemeinsame Forschungsstelle der Europäischen Kommission) arbeitet an GHS built-up grid
- CIESIN (Center for International Earth Science Information Network)
- [Verknüpfung] Klein Goldewijk, K., Beusen, A., Doelman, J., and Stehfest, E.: Anthropogenic land use estimates for the Holocene – HYDE 3.2, Earth Syst. Sci. Data, 9, 927–953, https://doi.org/10.5194/essd-9-927-2017, 2017.
Price Distribution
Geschäftsverteilung nach Preis für St. Moritz
Human Development Index (HDI)
Statistischer zusammengesetzter Index der Lebenserwartung, der Bildung und des Pro-Kopf-Einkommens.
CO2-Emissionen von St. Moritz
Kohlendioxid (CO2) -Emissionen pro Kopf in Tonnen pro Jahr
| Standort | CO2-Emissionen | CO2-Emissionen pro Kopf | Intensität der CO2-Emissionen |
|---|---|---|---|
| St. Moritz | 35,179 tn | 11.62 tn | 15,635 tons/km² |
| Kanton Graubünden | 2,370,443 tn | 11.55 tn | 333.6 tons/km² |
| Schweiz | 96,432,235 tn | 11.67 tn | 2,336 tons/km² |
| CO2-Emissionen 2013 (Tonnen/Jahr) | 35,179 tn |
| CO2-Emissionen 2013 (Tonnen/Jahr) pro Kopf | 11.62 tn |
| CO2-Emissionsintensität 2013 (Tonnen/km²/Jahr) | 15,635 tons/km² |
Naturgefahrenrisiko
Relatives Risiko von 10
| Gefahr | Risikostufe |
|---|---|
| Flut | Hoch (9) |
| Erdbeben | Mittel (4) |
* Das Risiko, insbesondere in Bezug auf Überschwemmungen oder Erdrutsche, gilt möglicherweise nicht für das gesamte Gebiet.
- Dilley, M., R.S. Chen, U. Deichmann, A.L. Lerner-Lam, M. Arnold, J. Agwe, P. Buys, O. Kjekstad, B. Lyon, and G. Yetman. 2005. Natural Disaster Hotspots: A Global Risk Analysis. Washington, D.C.: World Bank. https://doi.org/10.1596/0-8213-5930-4.
- Center for Hazards and Risk Research - CHRR - Columbia University, Center for International Earth Science Information Network - CIESIN - Columbia University. 2005. Global Flood Hazard Frequency and Distribution. Palisades, NY: NASA Socioeconomic Data and Applications Center (SEDAC). https://doi.org/10.7927/H4668B3D.
- Center for Hazards and Risk Research - CHRR - Columbia University, Center for International Earth Science Information Network - CIESIN - Columbia University. 2005. Global Earthquake Hazard Distribution - Peak Ground Acceleration. Palisades, NY: NASA Socioeconomic Data and Applications Center (SEDAC). https://doi.org/10.7927/H4BZ63ZS.
Aktuelle Erdbeben in der Nähe
Magnitude 3.0 und höher
| Datum▼ | Zeit↕ | Magnitude↕ | Distance↕ | Tiefe↕ | Standort↕ | Verknüpfung |
|---|---|---|---|---|---|---|
| 2/1/18 | 1:47 AM | 3.8 | 77.1 km | 5,000 m | 4km N of Innerbraz, Austria | usgs.gov |
| 1/17/18 | 7:07 PM | 4 | 75 km | 10,000 m | 2km NE of Innerbraz, Austria | usgs.gov |
| 11/28/15 | 9:29 PM | 3 | 78.8 km | 5,000 m | 2km N of Albino, Italy | usgs.gov |
| 12/12/13 | 12:59 AM | 3.6 | 67.3 km | 2,600 m | 1km SSW of Balzers, Liechtenstein | usgs.gov |
| 12/13/08 | 6:02 AM | 3.3 | 16.9 km | 1,000 m | northern Italy | usgs.gov |
| 11/9/08 | 7:22 AM | 3.7 | 58.6 km | 3,600 m | Switzerland | usgs.gov |
| 4/17/08 | 1:07 AM | 3.4 | 25.5 km | 5,200 m | Switzerland | usgs.gov |
| 1/21/08 | 4:40 PM | 4.2 | 42.1 km | 8,000 m | Switzerland | usgs.gov |
| 8/5/07 | 11:15 AM | 3.1 | 65.7 km | 0 m | Austria | usgs.gov |
| 10/24/06 | 8:05 PM | 3.3 | 27 km | 6,000 m | Switzerland | usgs.gov |
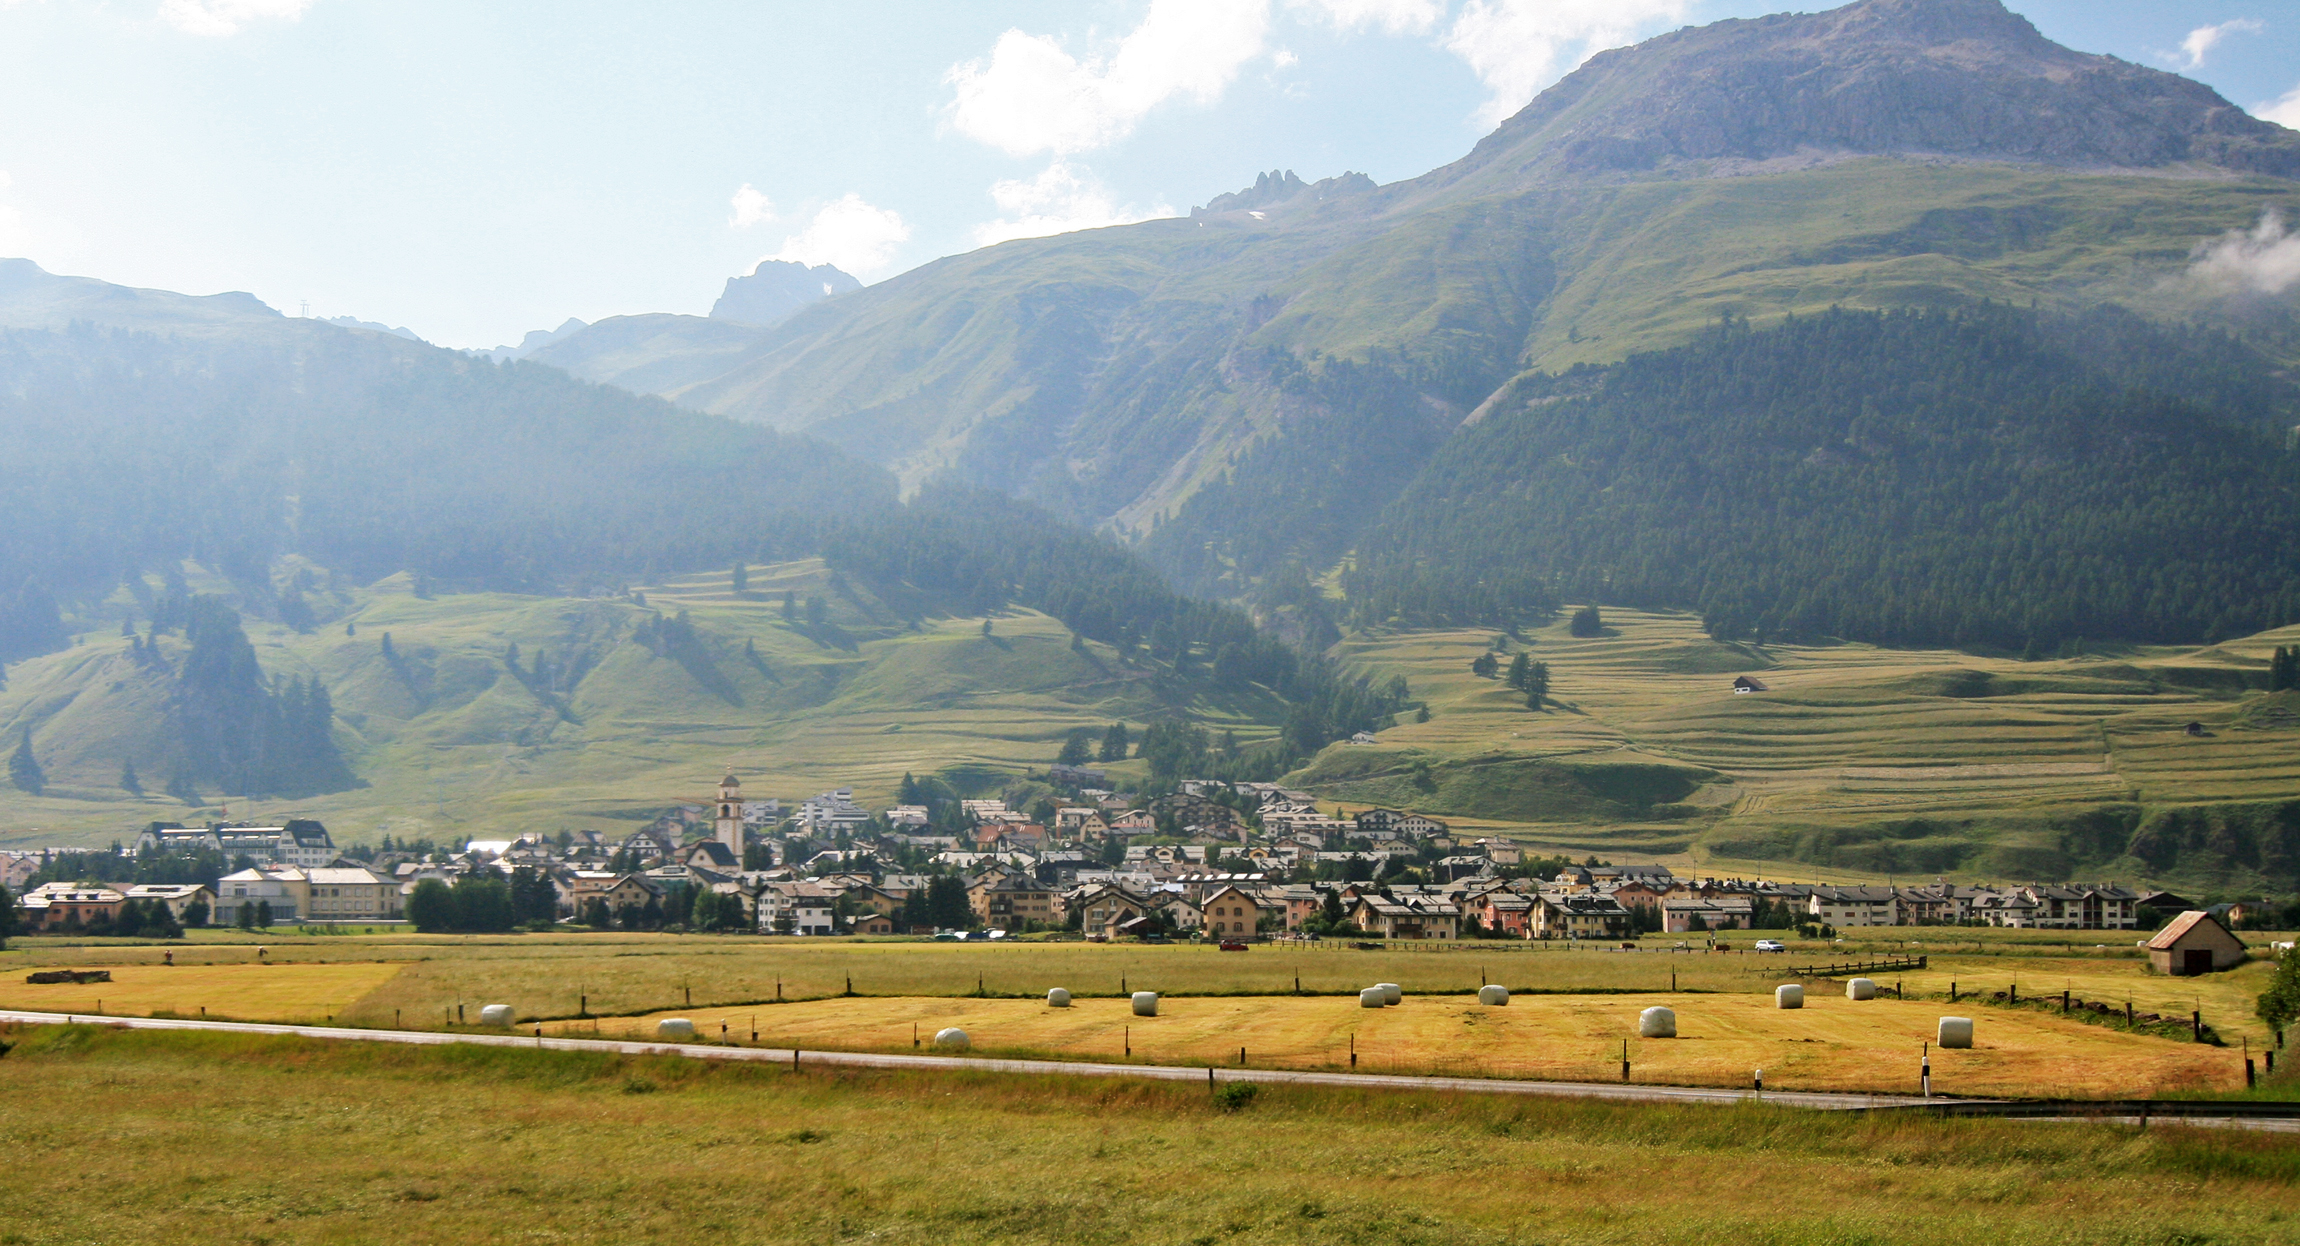
St. Moritz
St. Moritz (hochdeutsch [ˌsaŋktmoˈrɪts], bündnerdeutsch [ˌsamoˈrits], rätoromanisch San Murezzan?/i, italienisch San Maurizio, französisch Saint-Moritz, lokaler Übername der Bewohner ils draguns ‚die Drachen‘) ist eine politische Gemeinde im Kreis Oberengadin..
St. Moritz Wikipedia-Seite

Über unsere Daten
Die Daten auf dieser Seite werden anhand verschiedener öffentlich zugänglicher Werkzeuge und Quellen geschätzt. Sie werden ohne Gewähr bereitgestellt und können Ungenauigkeiten enthalten. Nutzung auf eigene Gefahr.