Guáimaro Facts
| Gebiet | 1530.0 km² |
| Bevölkerung | 27.939 |
| Männliche Bevölkerung | 14.232 (50.9%) |
| Weibliche Bevölkerung | 13.707 (49.1%) |
| Population change (1975 to 2020) | -72.8% |
| Population change (2000 to 2020) | -40.8% |
| Mittleres Alter | 39.6 years (Male: 38.9, Female: 40.2) |
| Zeit vor Ort | |
| Zeitzone | Kubanische Sommerzeit |
| Geogr. Länge & Breite | 21.05176, -77.35021 |
| Postleitzahlen | 72600 |
Karte von Guáimaro
Interaktive Karte
Bevölkerung von Guáimaro
Jahre 1975 bis 2020
| Data | 1975 | 1990 | 2000 | 2015 | 2020 |
|---|---|---|---|---|---|
| Bevölkerung | 102.816 | 64.766 | 47.158 | 28.209 | 27.939 |
| Bevölkerungsdichte | 67,2 / km² | 42,3 / km² | 30,8 / km² | 18,4 / km² | 18,3 / km² |
Bevölkerungsänderung in Guáimaro von 2000 bis 2015
Rückgang um 40.2 % von 2000 bis 2015
| Standort | Änderung seit 1975 | Änderung seit 1990 | Änderung seit 2000 |
|---|---|---|---|
| Guáimaro | -72.6% | -56.4% | -40.2% |
| Camagüey | +6.2% | +1.9% | +0% |
| Kuba | +20.8% | +7.6% | +2.4% |
Medianalter von Guáimaro
Medianalter: 39.6 Jahre
| Standort | Mittleres Alter | Durchschnittsalter (weiblich) | Durchschnittsalter (männlich) |
|---|---|---|---|
| Guáimaro | 39.6 yrs | 40.2 yrs | 38.9 yrs |
| Camagüey | 39.6 yrs | 40.2 yrs | 38.9 yrs |
| Kuba | 39.5 yrs | 40.4 yrs | 38.6 yrs |
Bevölkerungsdichte von Guáimaro
Bevölkerungsdichte: 18,3 / km²
| Standort | Bevölkerung | Gebiet | Dichte |
|---|---|---|---|
| Guáimaro | 27.939 | 1.530 km² | 18,3 / km² |
| Camagüey | 778.437 | 15.804,4 km² | 49,3 / km² |
| Kuba | 11,2 million | 111.150,7 km² | 101 / km² |
Historische und prognostizierte Bevölkerung von Guáimaro
Geschätzte Bevölkerung von 1400 bis 2100
- JRC (Gemeinsame Forschungsstelle der Europäischen Kommission) arbeitet an GHS built-up grid
- CIESIN (Center for International Earth Science Information Network)
- [Verknüpfung] Klein Goldewijk, K., Beusen, A., Doelman, J., and Stehfest, E.: Anthropogenic land use estimates for the Holocene – HYDE 3.2, Earth Syst. Sci. Data, 9, 927–953, https://doi.org/10.5194/essd-9-927-2017, 2017.
Human Development Index (HDI)
Statistischer zusammengesetzter Index der Lebenserwartung, der Bildung und des Pro-Kopf-Einkommens.
CO2-Emissionen von Guáimaro
Kohlendioxid (CO2) -Emissionen pro Kopf in Tonnen pro Jahr
| Standort | CO2-Emissionen | CO2-Emissionen pro Kopf | Intensität der CO2-Emissionen |
|---|---|---|---|
| Guáimaro | 97,894 tn | 3.5 tn | 64 tons/km² |
| Camagüey | 2,645,160 tn | 3.4 tn | 167.4 tons/km² |
| Kuba | 38,319,156 tn | 3.41 tn | 344.7 tons/km² |
| CO2-Emissionen 2013 (Tonnen/Jahr) | 97,894 tn |
| CO2-Emissionen 2013 (Tonnen/Jahr) pro Kopf | 3.5 tn |
| CO2-Emissionsintensität 2013 (Tonnen/km²/Jahr) | 64 tons/km² |
Naturgefahrenrisiko
Relatives Risiko von 10
| Gefahr | Risikostufe |
|---|---|
| Dürre | Mittel (3.8) |
| Flut | Mittel (7) |
| Erdbeben | Mittel (4) |
| Zyklon | Hoch (8) |
* Das Risiko, insbesondere in Bezug auf Überschwemmungen oder Erdrutsche, gilt möglicherweise nicht für das gesamte Gebiet.
- Dilley, M., R.S. Chen, U. Deichmann, A.L. Lerner-Lam, M. Arnold, J. Agwe, P. Buys, O. Kjekstad, B. Lyon, and G. Yetman. 2005. Natural Disaster Hotspots: A Global Risk Analysis. Washington, D.C.: World Bank. https://doi.org/10.1596/0-8213-5930-4.
- Center for Hazards and Risk Research - CHRR - Columbia University, Center for International Earth Science Information Network - CIESIN - Columbia University, International Bank for Reconstruction and Development - The World Bank, and United Nations Environment Programme Global Resource Information Database Geneva - UNEP/GRID-Geneva. 2005. Global Cyclone Hazard Frequency and Distribution. Palisades, NY: NASA Socioeconomic Data and Applications Center (SEDAC). https://doi.org/10.7927/H4CZ353K.
- Center for Hazards and Risk Research - CHRR - Columbia University, Center for International Earth Science Information Network - CIESIN - Columbia University, and International Research Institute for Climate and Society - IRI - Columbia University. 2005. Global Drought Hazard Frequency and Distribution. Palisades, NY: NASA Socioeconomic Data and Applications Center (SEDAC). https://doi.org/10.7927/H4VX0DFT.
- Center for Hazards and Risk Research - CHRR - Columbia University, Center for International Earth Science Information Network - CIESIN - Columbia University. 2005. Global Flood Hazard Frequency and Distribution. Palisades, NY: NASA Socioeconomic Data and Applications Center (SEDAC). https://doi.org/10.7927/H4668B3D.
- Center for Hazards and Risk Research - CHRR - Columbia University, Center for International Earth Science Information Network - CIESIN - Columbia University. 2005. Global Earthquake Hazard Distribution - Peak Ground Acceleration. Palisades, NY: NASA Socioeconomic Data and Applications Center (SEDAC). https://doi.org/10.7927/H4BZ63ZS.
Guáimaro
ist ein Municipio und eine Stadt im südlichen Teil der kubanischen Provinz Camagüey. Sie befindet sich zwischen Camagüey und Victoria de Las Tunas. Gemeinde entstand 1943, als sie sich von der Stadt Camagüey abspaltete. Guáimaro ist in die Barrios Elia, Cam..
Guáimaro Wikipedia-Seite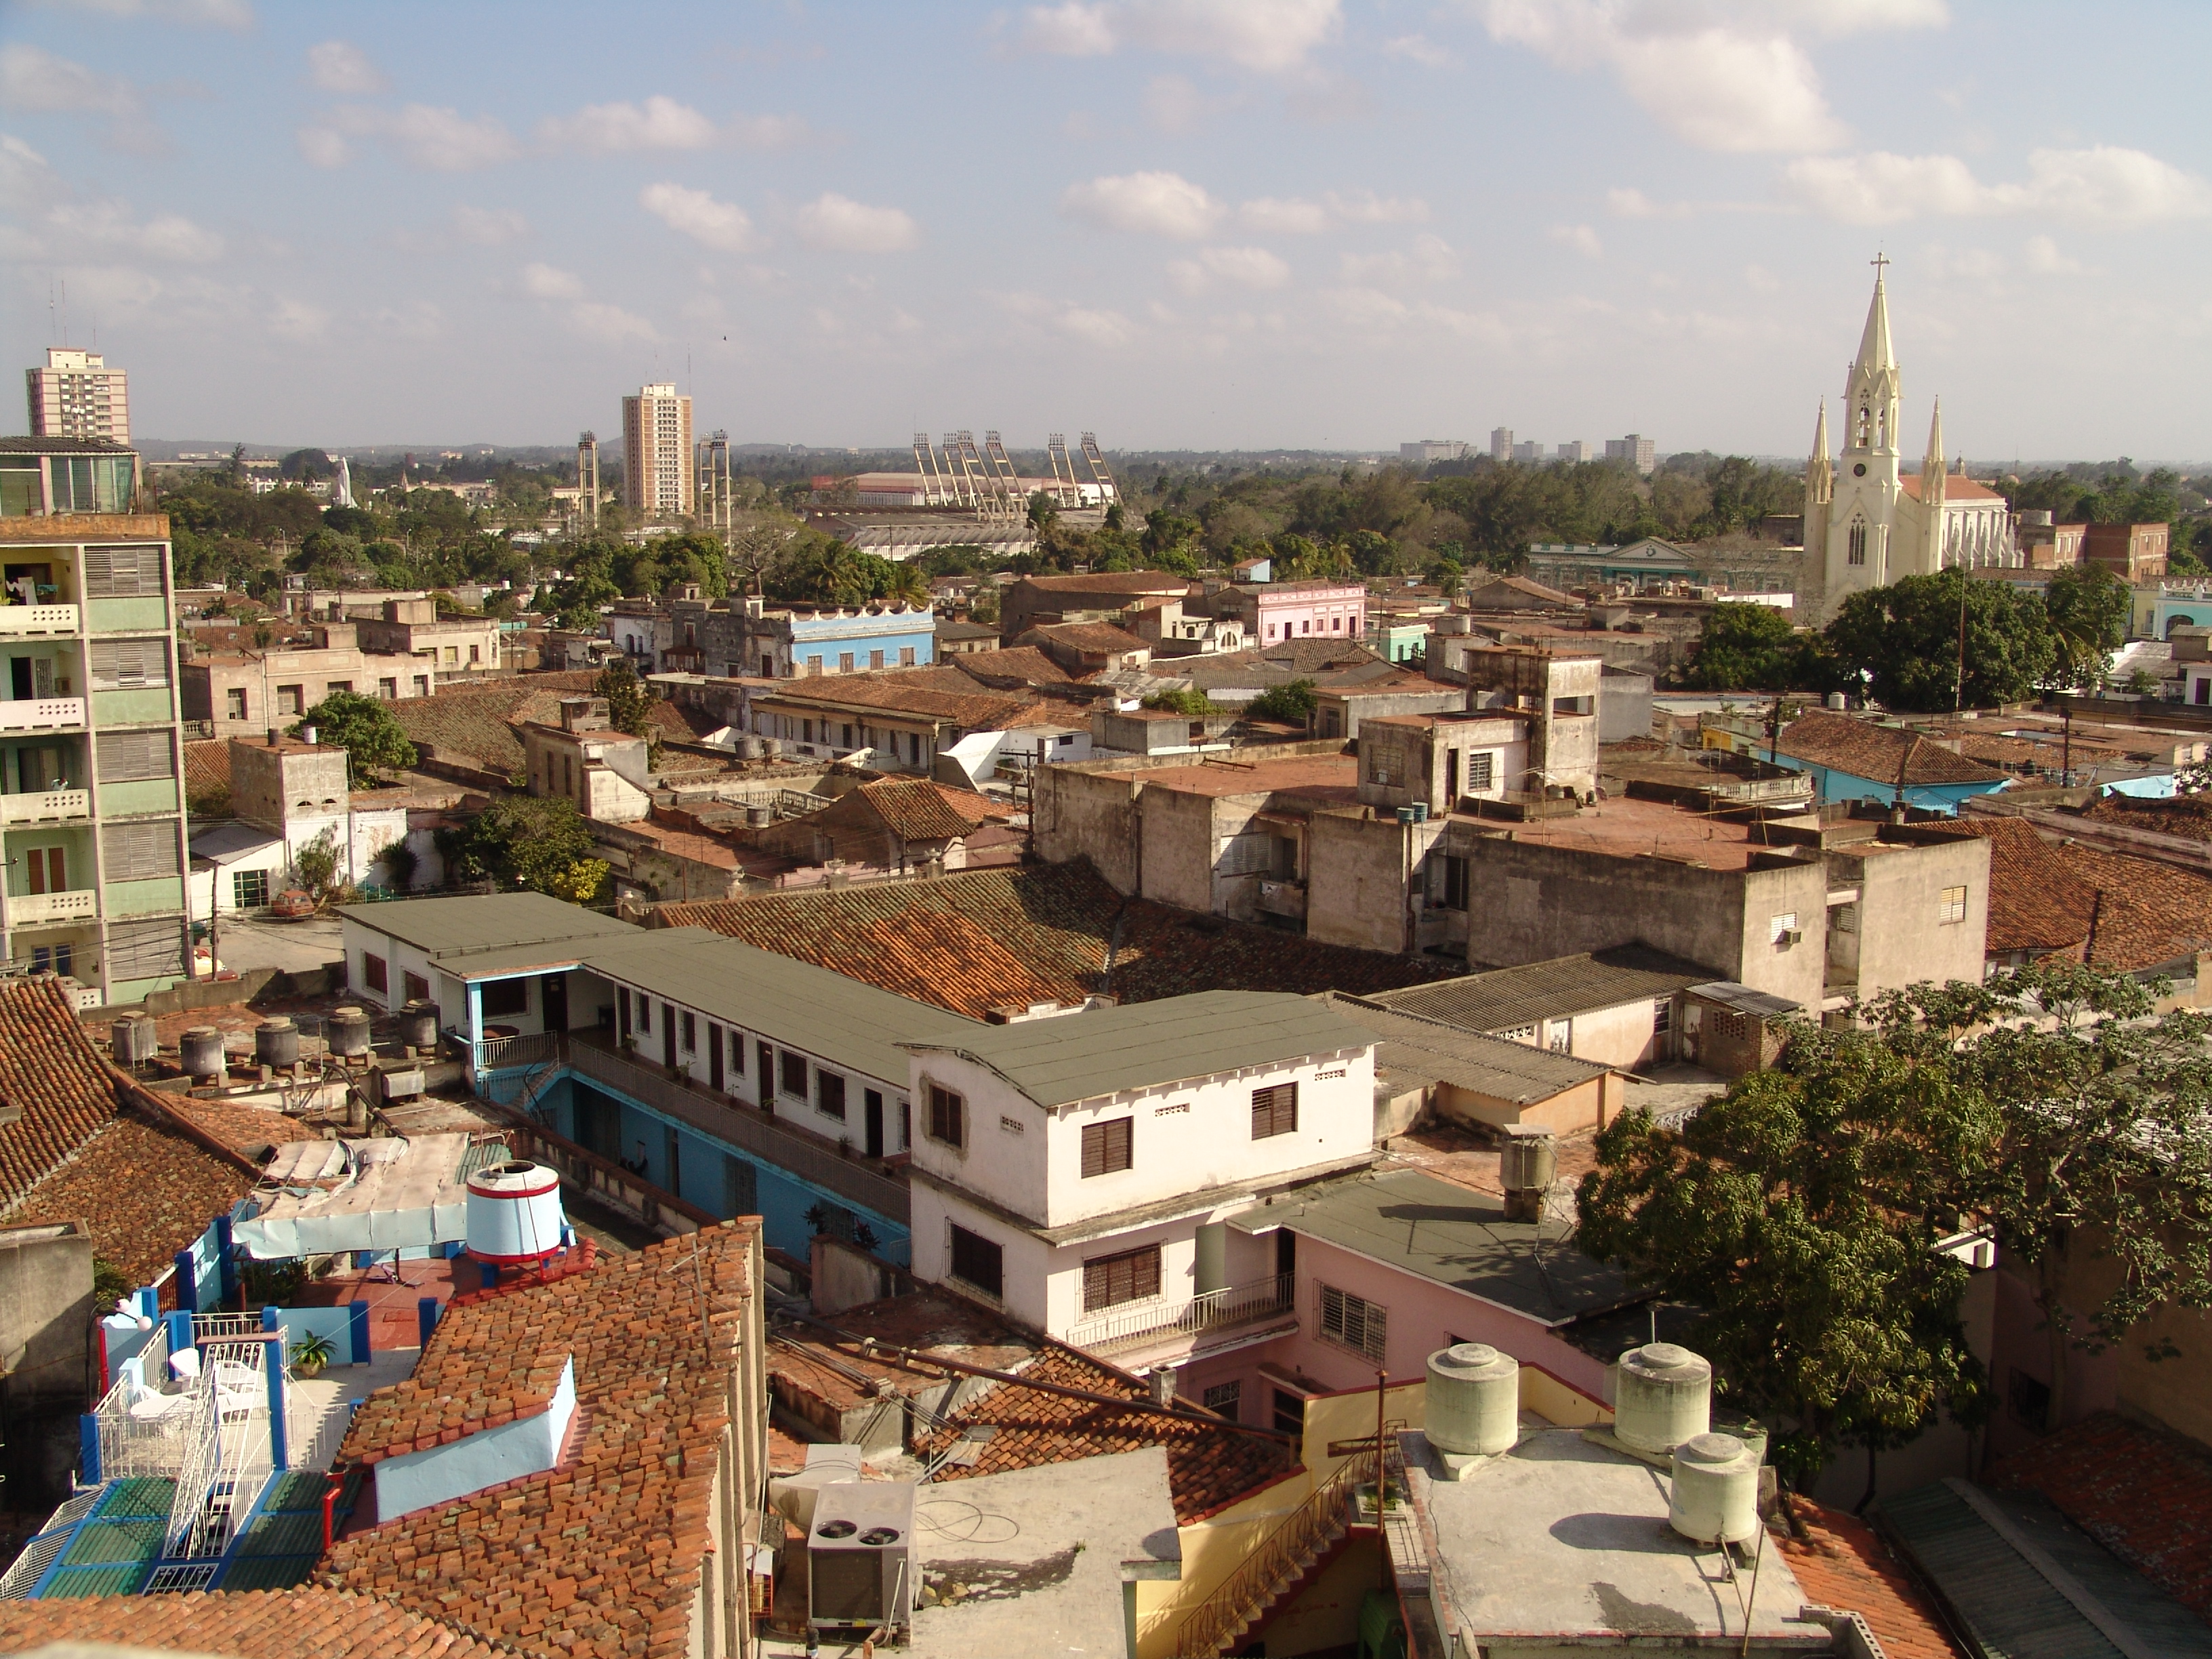


Über unsere Daten
Die Daten auf dieser Seite werden anhand verschiedener öffentlich zugänglicher Werkzeuge und Quellen geschätzt. Sie werden ohne Gewähr bereitgestellt und können Ungenauigkeiten enthalten. Nutzung auf eigene Gefahr.