Maisí Facts
| Gebiet | 426.3 km² |
| Bevölkerung | 27.686 |
| Männliche Bevölkerung | 14.626 (52.8%) |
| Weibliche Bevölkerung | 13.060 (47.2%) |
| Population change (1975 to 2020) | +23.7% |
| Population change (2000 to 2020) | +1.5% |
| Mittleres Alter | 36 years (Male: 35.2, Female: 36.8) |
| Zeit vor Ort | |
| Zeitzone | Kubanische Sommerzeit |
| Geogr. Länge & Breite | 20.24673, -74.15181 |
| Postleitzahlen | 99370 |
Karte von Maisí
Interaktive Karte
Bevölkerung von Maisí
Jahre 1975 bis 2020
| Data | 1975 | 1990 | 2000 | 2015 | 2020 |
|---|---|---|---|---|---|
| Bevölkerung | 22.384 | 25.607 | 27.272 | 28.041 | 27.686 |
| Bevölkerungsdichte | 52,5 / km² | 60,1 / km² | 64 / km² | 65,8 / km² | 65 / km² |
Bevölkerungsänderung in Maisí von 2000 bis 2015
Anstieg um 2.8 % von 2000 bis 2015
| Standort | Änderung seit 1975 | Änderung seit 1990 | Änderung seit 2000 |
|---|---|---|---|
| Maisí | +25.3% | +9.5% | +2.8% |
| Provinz Guantánamo | +32.9% | +13.7% | +5.3% |
| Kuba | +20.8% | +7.6% | +2.4% |
Medianalter von Maisí
Medianalter: 36 Jahre
| Standort | Mittleres Alter | Durchschnittsalter (weiblich) | Durchschnittsalter (männlich) |
|---|---|---|---|
| Maisí | 36 yrs | 36.8 yrs | 35.2 yrs |
| Provinz Guantánamo | 36.2 yrs | 37 yrs | 35.4 yrs |
| Kuba | 39.5 yrs | 40.4 yrs | 38.6 yrs |
Bevölkerungsdichte von Maisí
Bevölkerungsdichte: 65 / km²
| Standort | Bevölkerung | Gebiet | Dichte |
|---|---|---|---|
| Maisí | 27.686 | 426,3 km² | 65 / km² |
| Provinz Guantánamo | 500.934 | 6.222,2 km² | 80,5 / km² |
| Kuba | 11,2 million | 111.150,7 km² | 101 / km² |
Historische und prognostizierte Bevölkerung von Maisí
Geschätzte Bevölkerung von 1740 bis 2100
- JRC (Gemeinsame Forschungsstelle der Europäischen Kommission) arbeitet an GHS built-up grid
- CIESIN (Center for International Earth Science Information Network)
- [Verknüpfung] Klein Goldewijk, K., Beusen, A., Doelman, J., and Stehfest, E.: Anthropogenic land use estimates for the Holocene – HYDE 3.2, Earth Syst. Sci. Data, 9, 927–953, https://doi.org/10.5194/essd-9-927-2017, 2017.
Human Development Index (HDI)
Statistischer zusammengesetzter Index der Lebenserwartung, der Bildung und des Pro-Kopf-Einkommens.
CO2-Emissionen von Maisí
Kohlendioxid (CO2) -Emissionen pro Kopf in Tonnen pro Jahr
| Standort | CO2-Emissionen | CO2-Emissionen pro Kopf | Intensität der CO2-Emissionen |
|---|---|---|---|
| Maisí | 96,570 tn | 3.49 tn | 226.6 tons/km² |
| Provinz Guantánamo | 1,800,332 tn | 3.59 tn | 289.3 tons/km² |
| Kuba | 38,319,156 tn | 3.41 tn | 344.7 tons/km² |
| CO2-Emissionen 2013 (Tonnen/Jahr) | 96,570 tn |
| CO2-Emissionen 2013 (Tonnen/Jahr) pro Kopf | 3.49 tn |
| CO2-Emissionsintensität 2013 (Tonnen/km²/Jahr) | 226.6 tons/km² |
Naturgefahrenrisiko
Relatives Risiko von 10
| Gefahr | Risikostufe |
|---|---|
| Flut | Mittel (7) |
| Erdbeben | Mittel (5.8) |
| Zyklon | Mittel (5) |
* Das Risiko, insbesondere in Bezug auf Überschwemmungen oder Erdrutsche, gilt möglicherweise nicht für das gesamte Gebiet.
- Dilley, M., R.S. Chen, U. Deichmann, A.L. Lerner-Lam, M. Arnold, J. Agwe, P. Buys, O. Kjekstad, B. Lyon, and G. Yetman. 2005. Natural Disaster Hotspots: A Global Risk Analysis. Washington, D.C.: World Bank. https://doi.org/10.1596/0-8213-5930-4.
- Center for Hazards and Risk Research - CHRR - Columbia University, Center for International Earth Science Information Network - CIESIN - Columbia University, International Bank for Reconstruction and Development - The World Bank, and United Nations Environment Programme Global Resource Information Database Geneva - UNEP/GRID-Geneva. 2005. Global Cyclone Hazard Frequency and Distribution. Palisades, NY: NASA Socioeconomic Data and Applications Center (SEDAC). https://doi.org/10.7927/H4CZ353K.
- Center for Hazards and Risk Research - CHRR - Columbia University, Center for International Earth Science Information Network - CIESIN - Columbia University. 2005. Global Flood Hazard Frequency and Distribution. Palisades, NY: NASA Socioeconomic Data and Applications Center (SEDAC). https://doi.org/10.7927/H4668B3D.
- Center for Hazards and Risk Research - CHRR - Columbia University, Center for International Earth Science Information Network - CIESIN - Columbia University. 2005. Global Earthquake Hazard Distribution - Peak Ground Acceleration. Palisades, NY: NASA Socioeconomic Data and Applications Center (SEDAC). https://doi.org/10.7927/H4BZ63ZS.
Aktuelle Erdbeben in der Nähe
Magnitude 3.0 und höher
| Datum▼ | Zeit↕ | Magnitude↕ | Distance↕ | Tiefe↕ | Standort↕ | Verknüpfung |
|---|---|---|---|---|---|---|
| 8/5/19 | 12:34 AM | 4.3 | 76.3 km | 10,000 m | 91km SSE of Baracoa, Cuba | usgs.gov |
| 9/30/16 | 11:06 PM | 5 | 46.7 km | 10,000 m | 52km SSE of Baracoa, Cuba | usgs.gov |
| 3/28/16 | 1:57 PM | 4.4 | 36.5 km | 10,000 m | 58km WNW of Mole Saint-Nicolas, Haiti | usgs.gov |
| 3/23/15 | 6:11 AM | 4.3 | 90.4 km | 10,000 m | 54km WSW of Bombardopolis, Haiti | usgs.gov |
| 10/19/14 | 5:25 AM | 4.4 | 61.9 km | 10,430 m | 62km S of Baracoa, Cuba | usgs.gov |
| 2/12/10 | 12:09 PM | 5.3 | 49.4 km | 10,000 m | Cuba region | usgs.gov |
| 9/1/05 | 1:09 AM | 4.2 | 90.1 km | 35,000 m | Haiti region | usgs.gov |
| 1/5/99 | 9:26 PM | 4.7 | 92 km | 10,000 m | Cuba region | usgs.gov |
| 1/5/99 | 3:50 PM | 4.9 | 89.7 km | 10,000 m | Cuba region | usgs.gov |
| 12/28/98 | 7:23 AM | 5.6 | 80.3 km | 10,000 m | Cuba region | usgs.gov |
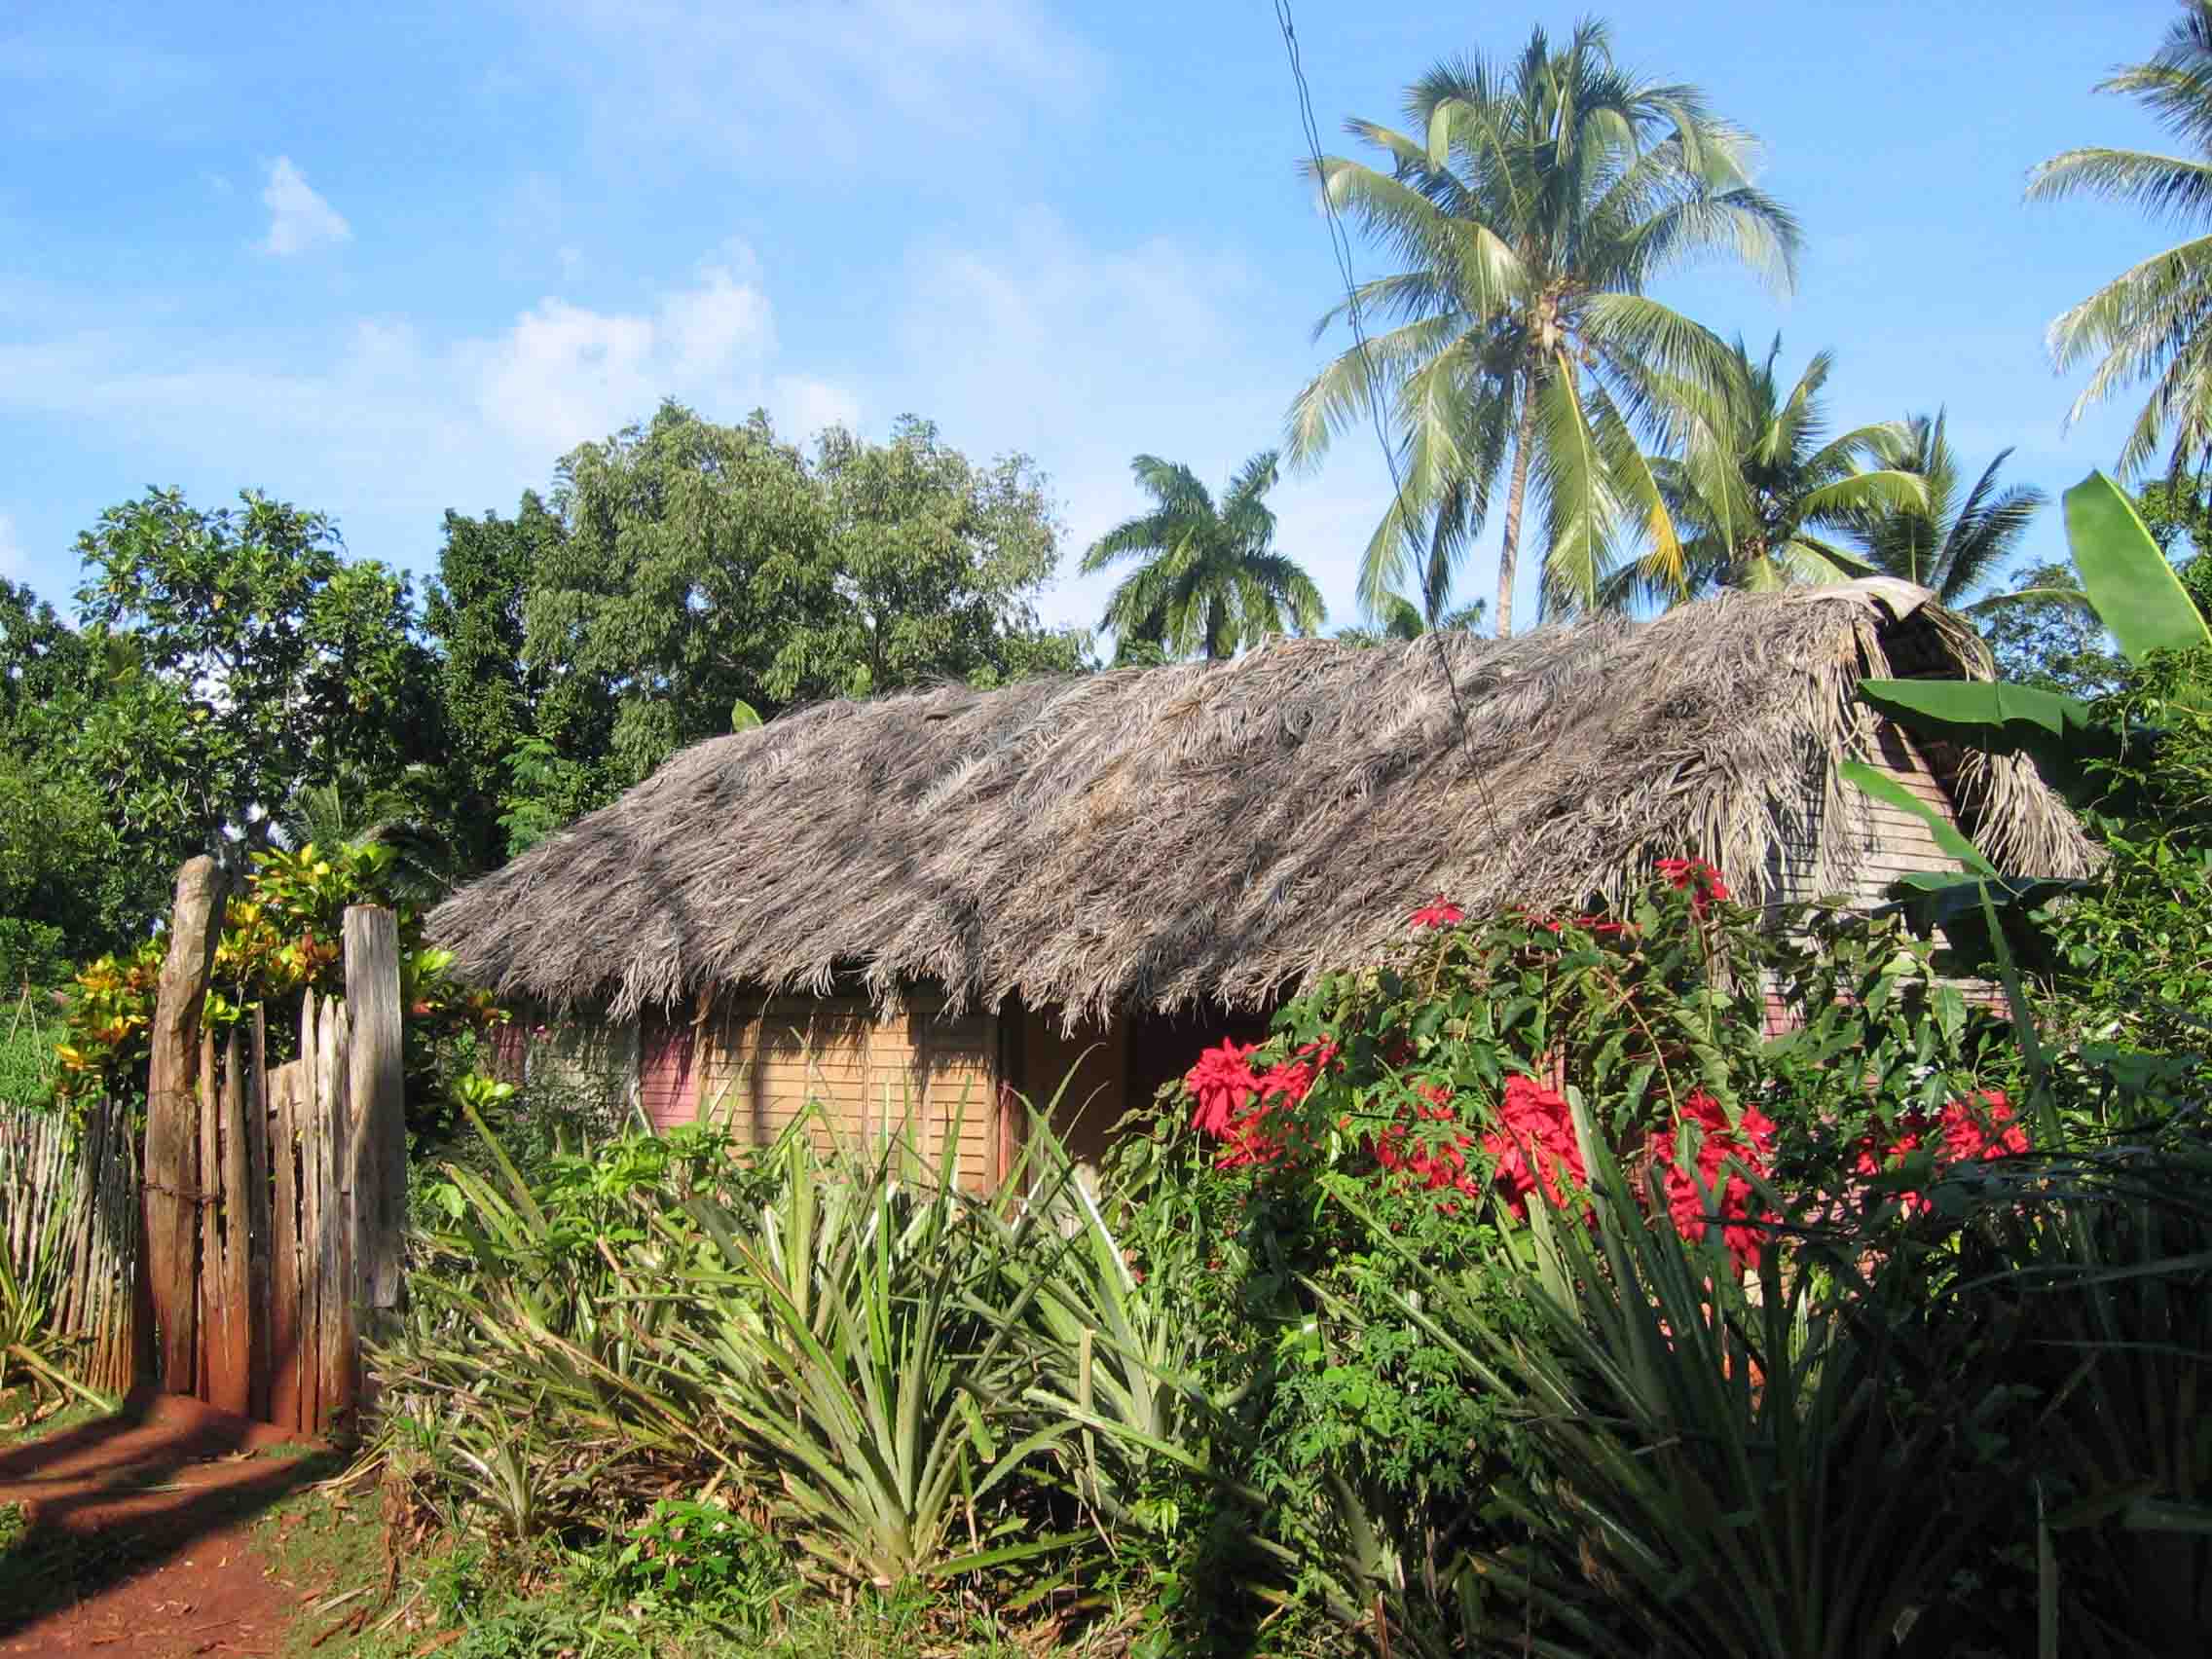
Maisí
Maisí ist eine Stadt und ein Municipio im äußersten Osten Kubas und gehört zur Provinz Guantánamo. Der Verwaltungssitz des Municipios ist nicht Maisí, sondern der größere Ort La Máquina. Auf dem Gebiet des Municipios liegt der östlichste Punkt Kubas – der „Pun..
Maisí Wikipedia-Seite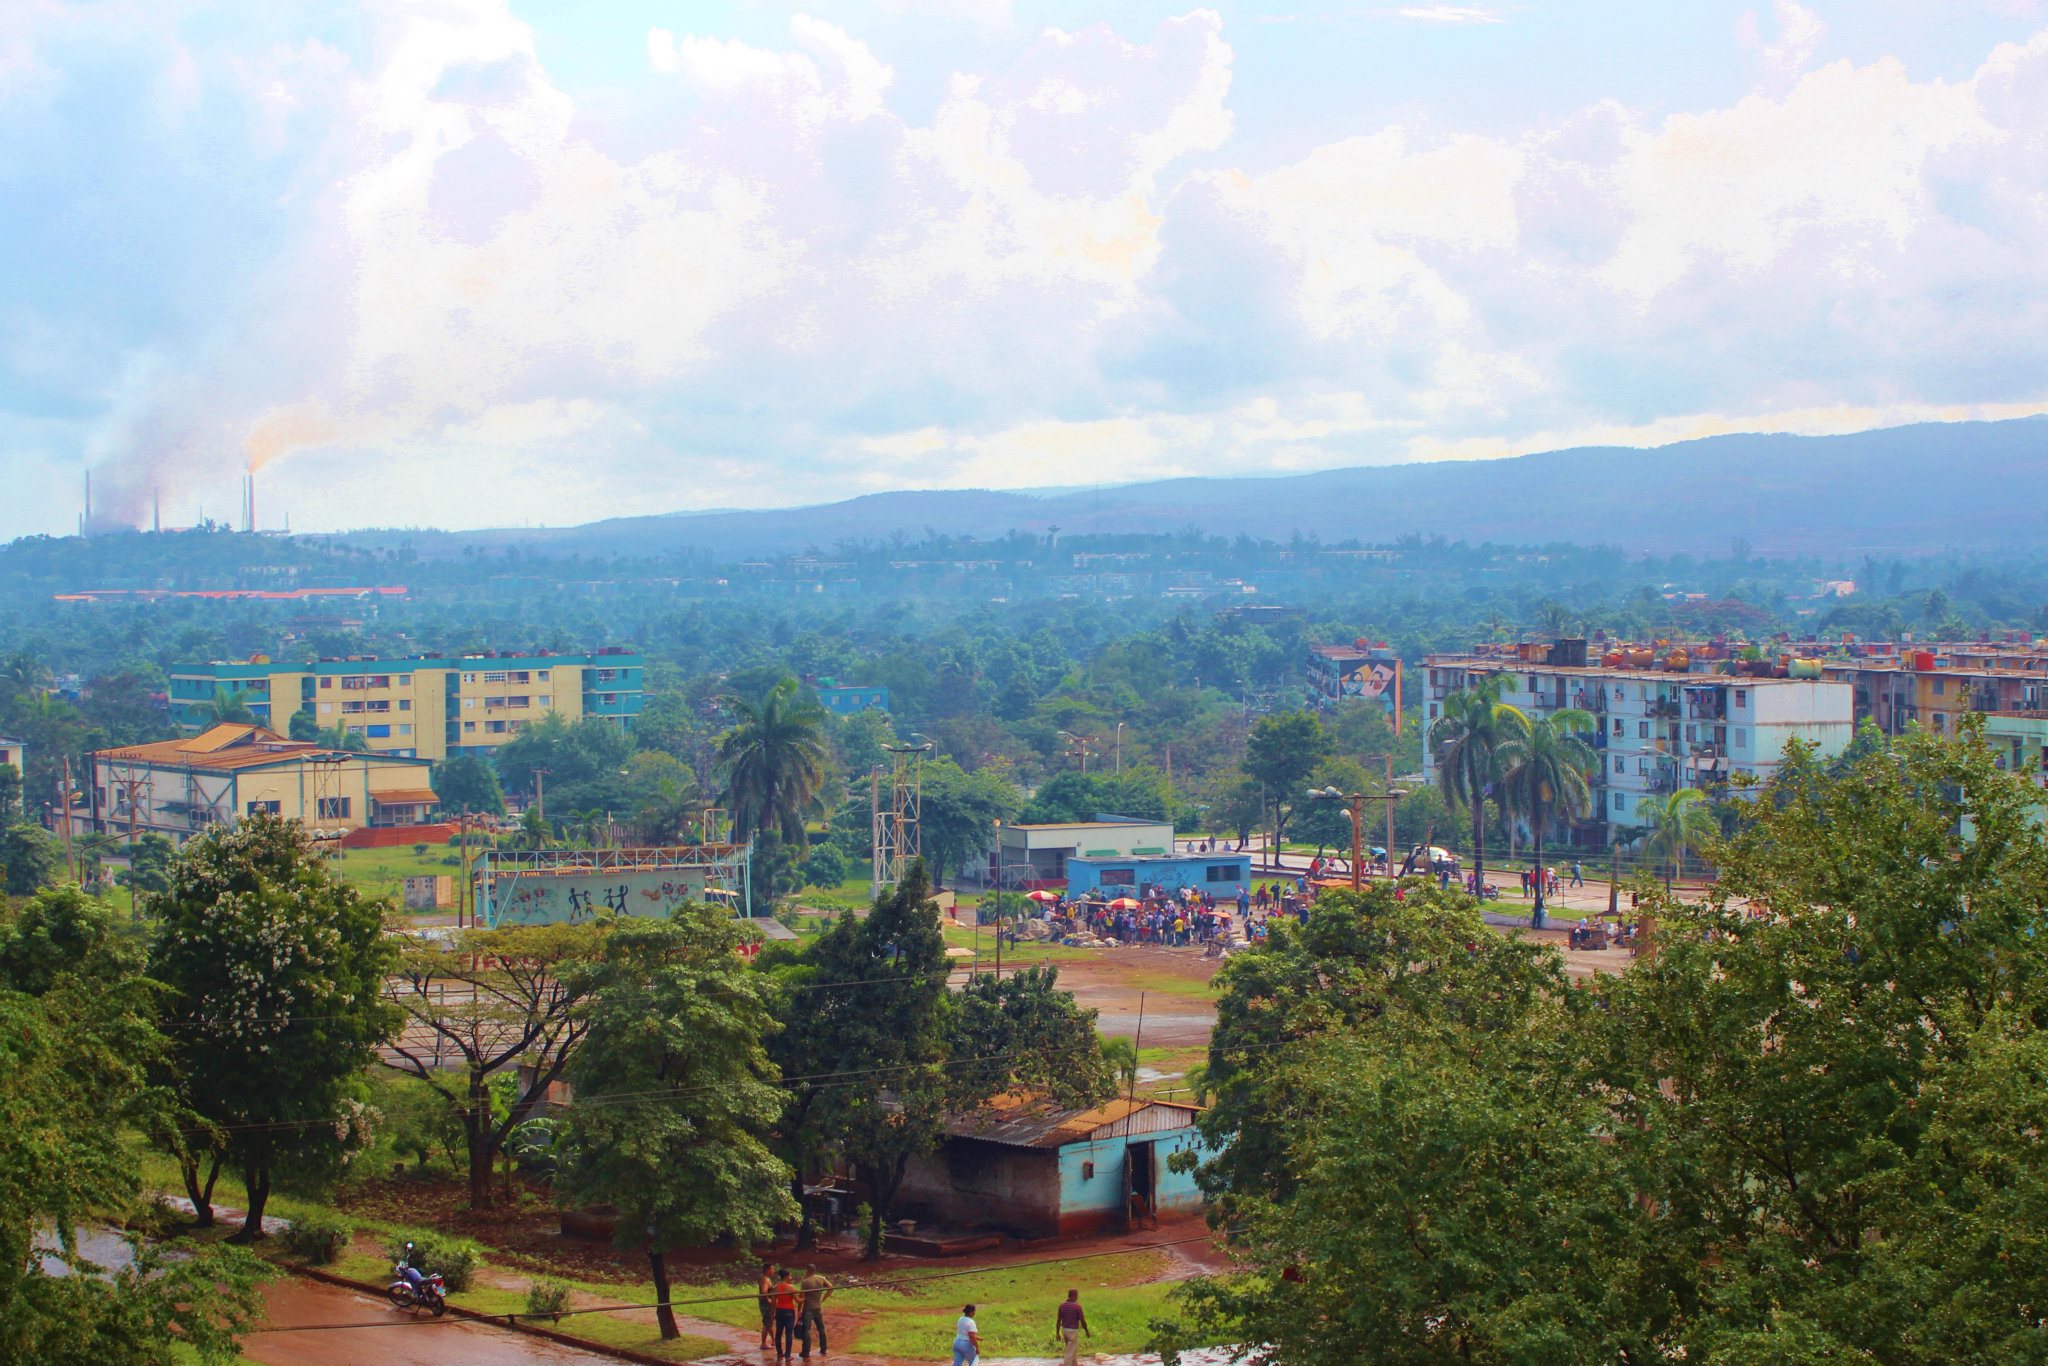
Über unsere Daten
Die Daten auf dieser Seite werden anhand verschiedener öffentlich zugänglicher Werkzeuge und Quellen geschätzt. Sie werden ohne Gewähr bereitgestellt und können Ungenauigkeiten enthalten. Nutzung auf eigene Gefahr.