Puerto Padre Facts
| Gebiet | 899.1 km² |
| Bevölkerung | 89.147 |
| Männliche Bevölkerung | 45.427 (51.0%) |
| Weibliche Bevölkerung | 43.720 (49.0%) |
| Population change (1975 to 2020) | +17.2% |
| Population change (2000 to 2020) | +1.5% |
| Mittleres Alter | 38.8 years (Male: 38.2, Female: 39.3) |
| BIP pro Kopf (KKP) | $2.128 (2022) |
| Zeit vor Ort | |
| Zeitzone | Kubanische Sommerzeit |
| Geogr. Länge & Breite | 21.19449, -76.60355 |
| Postleitzahlen | 77200 |
Karte von Puerto Padre
Interaktive Karte
Bevölkerung von Puerto Padre
Jahre 1975 bis 2030
| Data | 1975 | 1990 | 2000 | 2015 | 2020 | 2025* | 2030* |
|---|---|---|---|---|---|---|---|
| Bevölkerung | 76.068 | 84.670 | 87.834 | 87.941 | 89.147 | 87.432 | 85.571 |
| Bevölkerungsdichte | 84,6 / km² | 94,2 / km² | 97,7 / km² | 97,8 / km² | 99,2 / km² | 97,2 / km² | 95,2 / km² |
Bevölkerungsänderung in Puerto Padre von 2000 bis 2020
Anstieg um 1.5 % von 2000 bis 2020
| Standort | Änderung seit 1975 | Änderung seit 1990 | Änderung seit 2000 |
|---|---|---|---|
| Puerto Padre | +17.2% | +5.3% | +1.5% |
| Provinz Las Tunas | — | — | — |
| Kuba | — | — | — |
Medianalter von Puerto Padre
Medianalter: 38.8 Jahre
| Standort | Mittleres Alter | Durchschnittsalter (weiblich) | Durchschnittsalter (männlich) |
|---|---|---|---|
| Puerto Padre | 38.8 yrs | 39.3 yrs | 38.2 yrs |
| Provinz Las Tunas | 38.8 yrs | 39.3 yrs | 38.2 yrs |
| Kuba | 39.5 yrs | 40.4 yrs | 38.6 yrs |
Bevölkerungsdichte von Puerto Padre
Bevölkerungsdichte: 99,2 / km²
| Standort | Bevölkerung | Gebiet | Dichte |
|---|---|---|---|
| Puerto Padre | 89.147 | 899,1 km² | 99,2 / km² |
| Provinz Las Tunas | 542.989 | 6.596,5 km² | 82,3 / km² |
| Kuba | 11,2 million | 111.150,7 km² | 101 / km² |
Historische und prognostizierte Bevölkerung von Puerto Padre
Geschätzte Bevölkerung von 1800 bis 2100
- JRC (Gemeinsame Forschungsstelle der Europäischen Kommission) arbeitet an GHS built-up grid
- CIESIN (Center for International Earth Science Information Network)
- [Verknüpfung] Klein Goldewijk, K., Beusen, A., Doelman, J., and Stehfest, E.: Anthropogenic land use estimates for the Holocene – HYDE 3.2, Earth Syst. Sci. Data, 9, 927–953, https://doi.org/10.5194/essd-9-927-2017, 2017.
Human Development Index (HDI)
Statistischer zusammengesetzter Index der Lebenserwartung, der Bildung und des Pro-Kopf-Einkommens.
Bruttoinlandsprodukt (BIP) von Puerto Padre
BIP pro Kopf, KKP (konstante internationale $ von 2017)
| Data | 1990 | 1995 | 2000 | 2005 | 2010 | 2015 | 2020 | 2022 |
|---|---|---|---|---|---|---|---|---|
| BIP pro Kopf | $804 | $91 | $227 | $472 | $1.610 | $1.853 | $1.912 | $2.128 |
| BIP insgesamt | $64,2 Mio. | $7,5 Mio. | $18,8 Mio. | $39,3 Mio. | $132,7 Mio. | $151,5 Mio. | $154,7 Mio. | $170,8 Mio. |
CO2-Emissionen von Puerto Padre
Kohlendioxid (CO2) -Emissionen pro Kopf in Tonnen pro Jahr
| Standort | CO2-Emissionen | CO2-Emissionen pro Kopf | Intensität der CO2-Emissionen |
|---|---|---|---|
| Puerto Padre | 294,617 tn | 3.3 tn | 327.7 tons/km² |
| Provinz Las Tunas | 1,868,435 tn | 3.44 tn | 283.2 tons/km² |
| Kuba | 38,319,156 tn | 3.41 tn | 344.7 tons/km² |
| CO2-Emissionen 2013 (Tonnen/Jahr) | 294,617 tn |
| CO2-Emissionen 2013 (Tonnen/Jahr) pro Kopf | 3.3 tn |
| CO2-Emissionsintensität 2013 (Tonnen/km²/Jahr) | 327.7 tons/km² |
Naturgefahrenrisiko
Relatives Risiko von 10
| Gefahr | Risikostufe |
|---|---|
| Dürre | Mittel (4) |
| Flut | Mittel (7) |
| Erdbeben | Mittel (3.7) |
| Zyklon | Mittel (7) |
* Das Risiko, insbesondere in Bezug auf Überschwemmungen oder Erdrutsche, gilt möglicherweise nicht für das gesamte Gebiet.
- Dilley, M., R.S. Chen, U. Deichmann, A.L. Lerner-Lam, M. Arnold, J. Agwe, P. Buys, O. Kjekstad, B. Lyon, and G. Yetman. 2005. Natural Disaster Hotspots: A Global Risk Analysis. Washington, D.C.: World Bank. https://doi.org/10.1596/0-8213-5930-4.
- Center for Hazards and Risk Research - CHRR - Columbia University, Center for International Earth Science Information Network - CIESIN - Columbia University, International Bank for Reconstruction and Development - The World Bank, and United Nations Environment Programme Global Resource Information Database Geneva - UNEP/GRID-Geneva. 2005. Global Cyclone Hazard Frequency and Distribution. Palisades, NY: NASA Socioeconomic Data and Applications Center (SEDAC). https://doi.org/10.7927/H4CZ353K.
- Center for Hazards and Risk Research - CHRR - Columbia University, Center for International Earth Science Information Network - CIESIN - Columbia University, and International Research Institute for Climate and Society - IRI - Columbia University. 2005. Global Drought Hazard Frequency and Distribution. Palisades, NY: NASA Socioeconomic Data and Applications Center (SEDAC). https://doi.org/10.7927/H4VX0DFT.
- Center for Hazards and Risk Research - CHRR - Columbia University, Center for International Earth Science Information Network - CIESIN - Columbia University. 2005. Global Flood Hazard Frequency and Distribution. Palisades, NY: NASA Socioeconomic Data and Applications Center (SEDAC). https://doi.org/10.7927/H4668B3D.
- Center for Hazards and Risk Research - CHRR - Columbia University, Center for International Earth Science Information Network - CIESIN - Columbia University. 2005. Global Earthquake Hazard Distribution - Peak Ground Acceleration. Palisades, NY: NASA Socioeconomic Data and Applications Center (SEDAC). https://doi.org/10.7927/H4BZ63ZS.
Aktuelle Erdbeben in der Nähe
Magnitude 3.0 und höher
| Datum▼ | Zeit↕ | Magnitude↕ | Distance↕ | Tiefe↕ | Standort↕ | Verknüpfung |
|---|---|---|---|---|---|---|
| 6/10/07 | 2:40 PM | 4 | 39.1 km | 21,100 m | Cuba region | usgs.gov |
| 11/19/01 | 1:46 AM | 4.2 | 83.5 km | 33,000 m | Cuba region | usgs.gov |
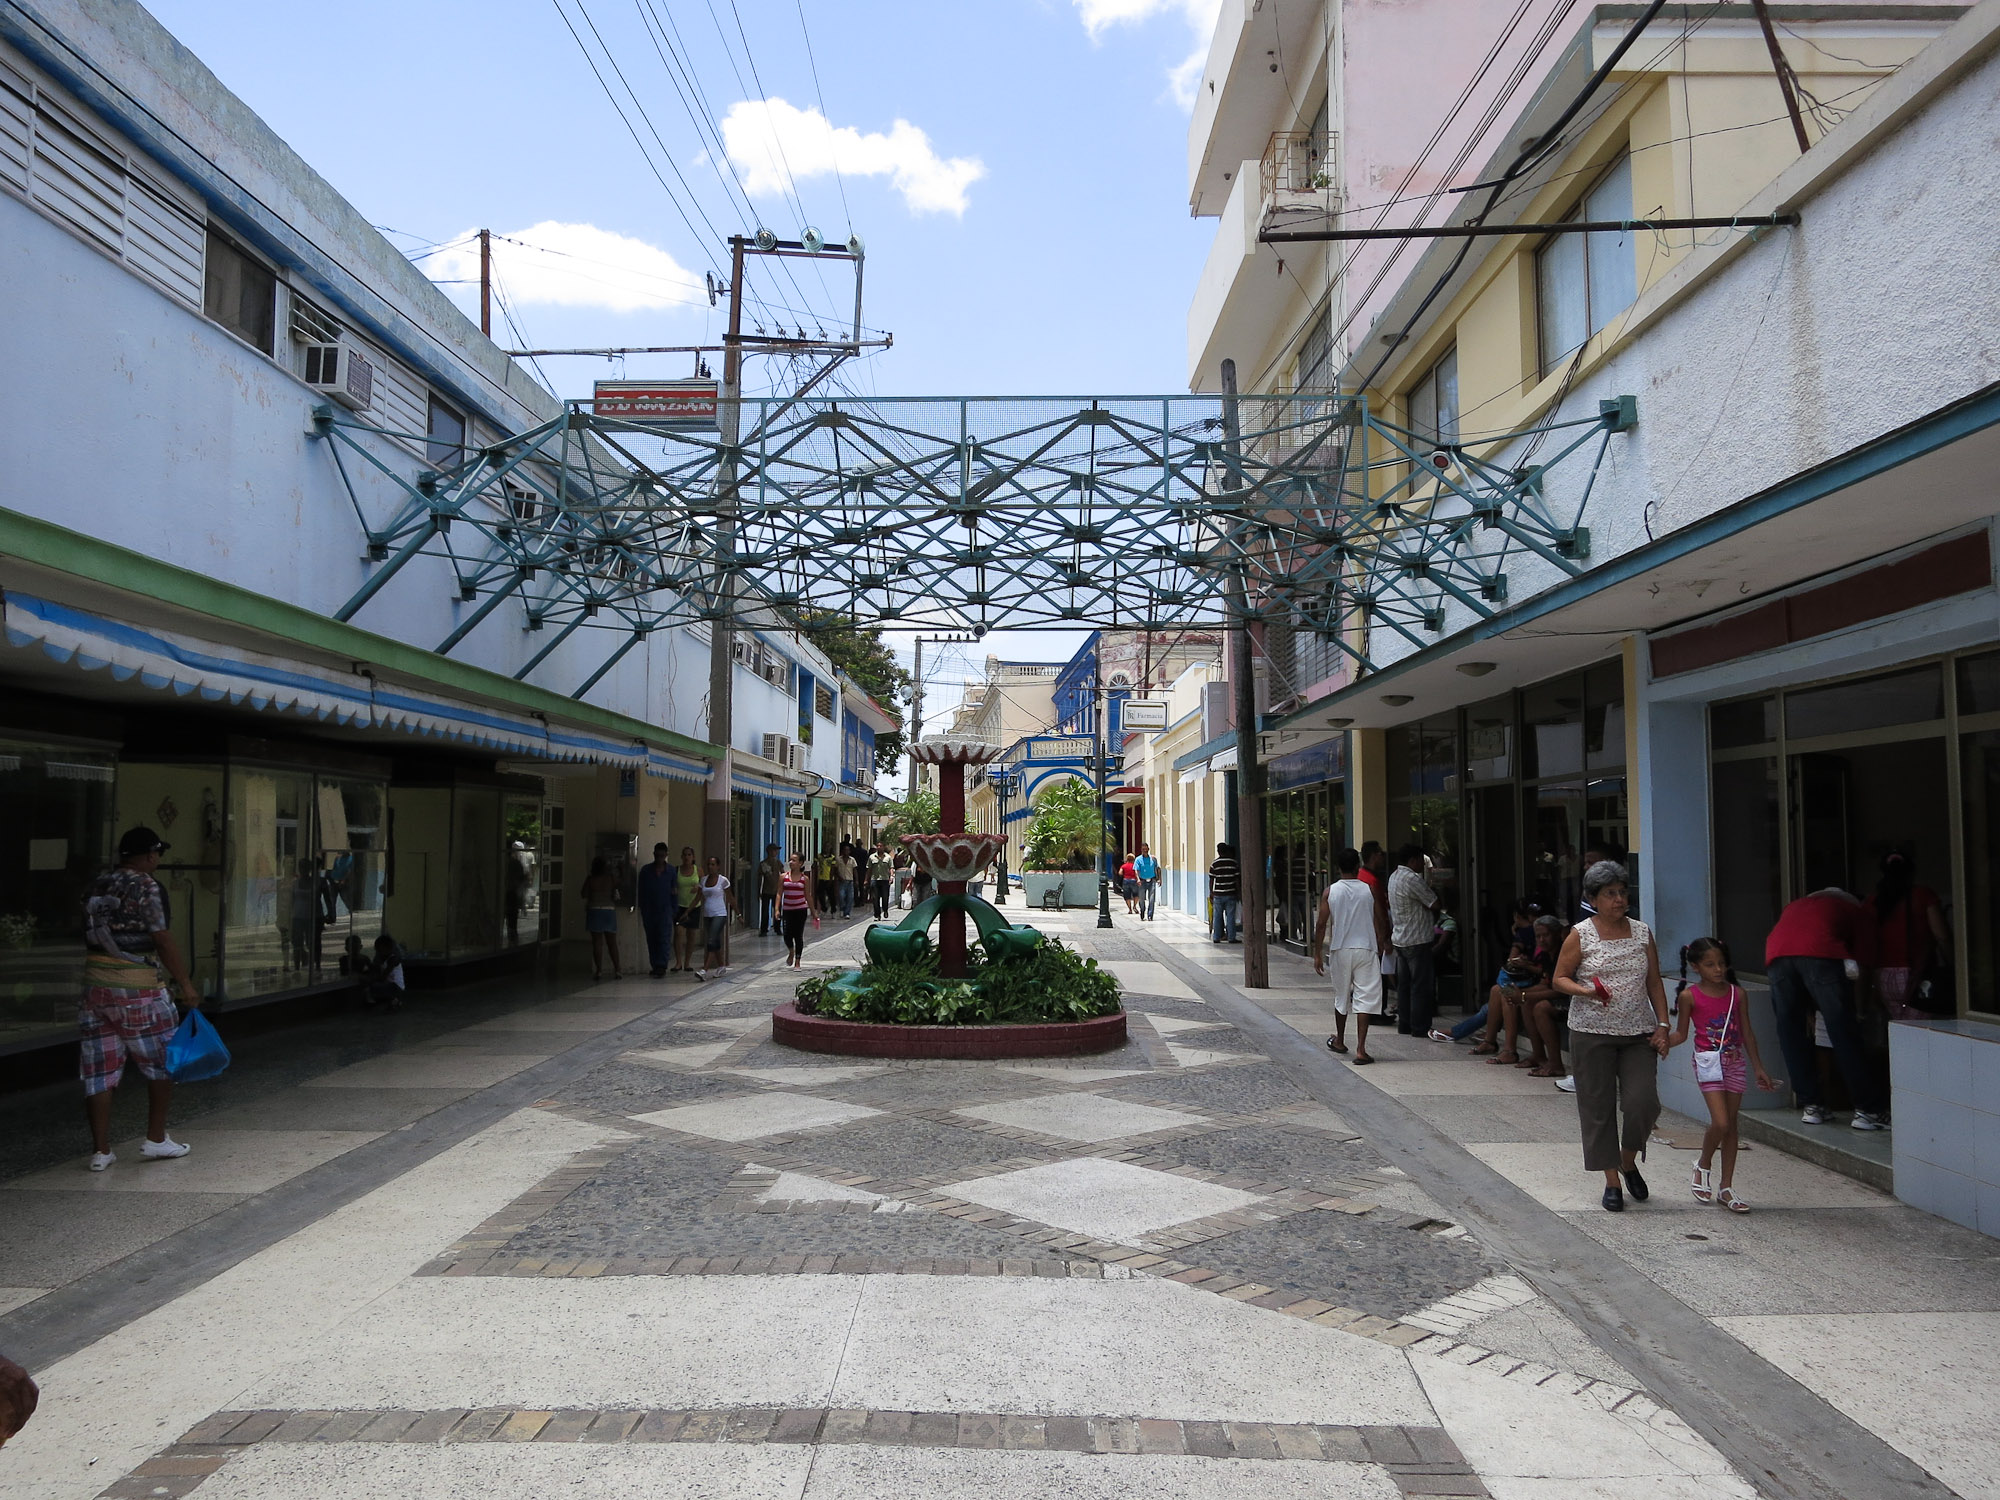
Puerto Padre
Puerto Padre ist eine Stadt und ein Municipio in der Provinz Las Tunas in Kuba. Die Stadt liegt in der nördlichen Küstenregion der Provinz an der gleichnamigen Puerto-Padre-Bucht. Puerto Padre hatte 2004 eine Einwohnerzahl von 93.705 bei einer Fläche von 1.178..
Puerto Padre Wikipedia-Seite

Über unsere Daten
Die Daten auf dieser Seite werden anhand verschiedener öffentlich zugänglicher Werkzeuge und Quellen geschätzt. Sie werden ohne Gewähr bereitgestellt und können Ungenauigkeiten enthalten. Nutzung auf eigene Gefahr.