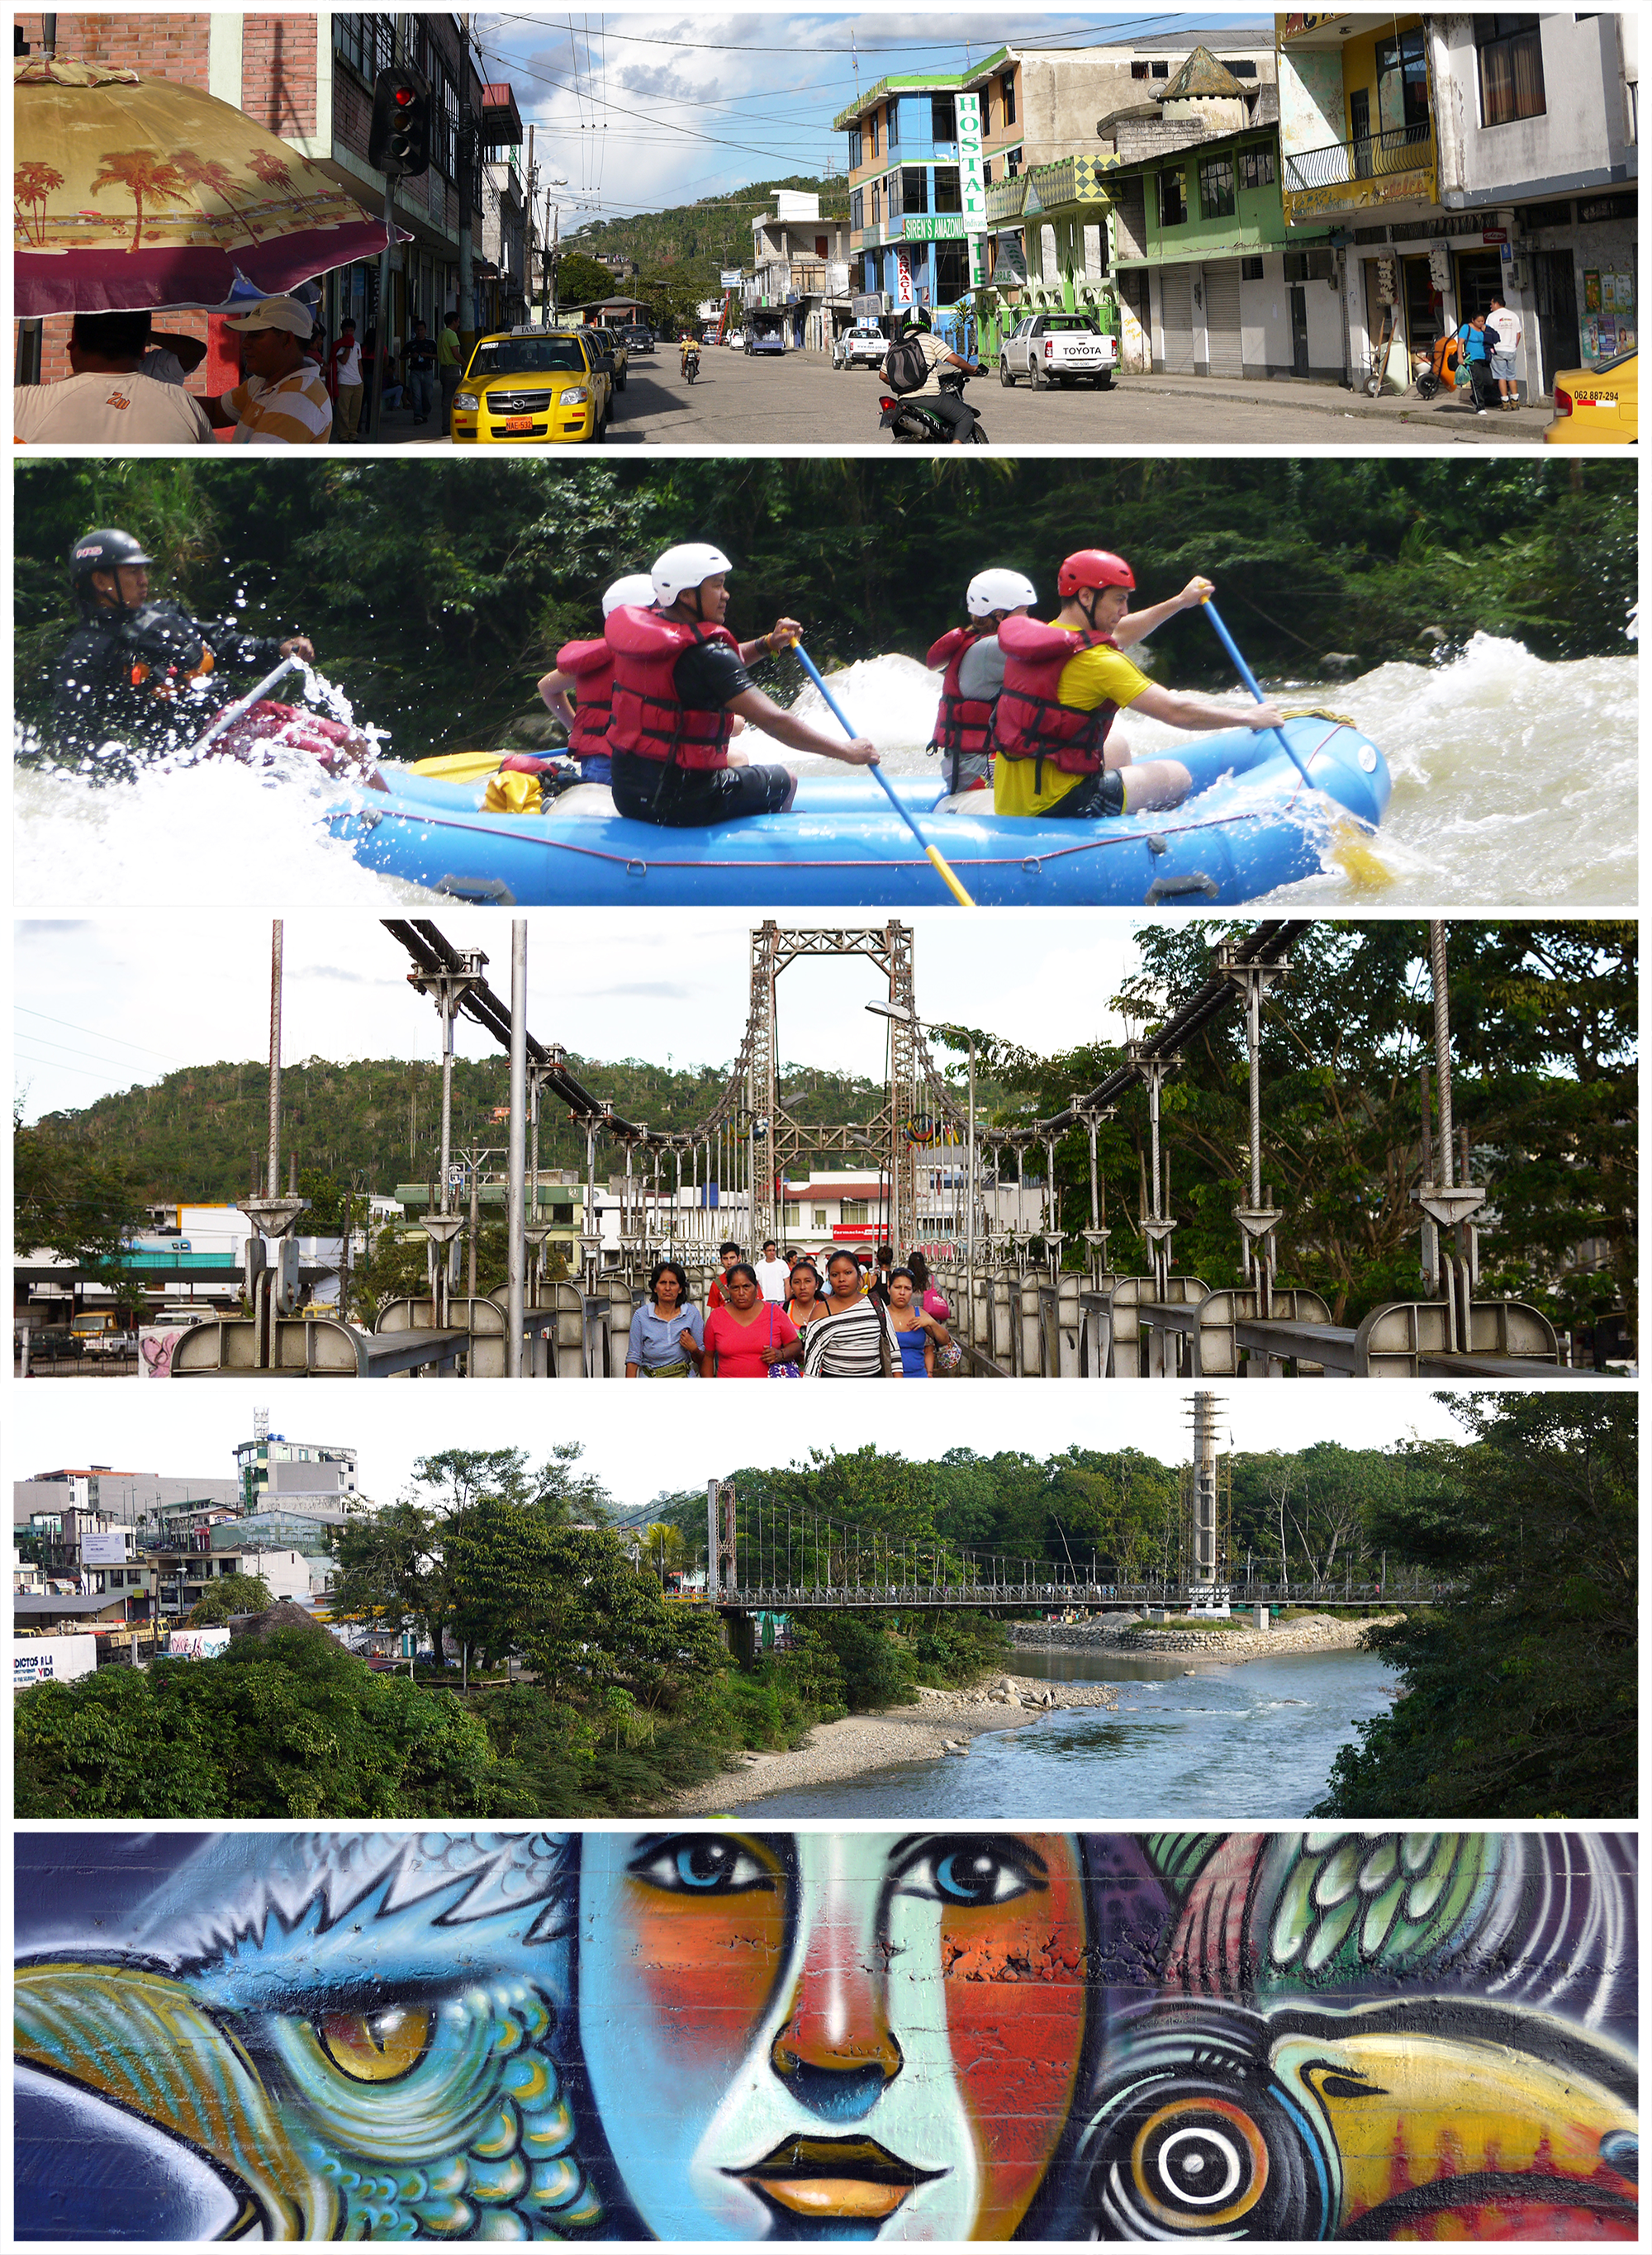
Arajuno Facts
| Gebiet | 518.8 km² |
| Bevölkerung | 5.218 |
| Männliche Bevölkerung | 2.713 (52.0%) |
| Weibliche Bevölkerung | 2.505 (48.0%) |
| Population change (1975 to 2020) | +377.8% |
| Population change (2000 to 2020) | +81.7% |
| Mittleres Alter | 16.3 years (Male: 17.1, Female: 15.4) |
| BIP pro Kopf (KKP) | $4.105 (2022) |
| Zeit vor Ort | |
| Zeitzone | Ecuadorianische Zeit |
| Geogr. Länge & Breite | -1.23282, -77.68736 |
| Postleitzahlen | 160151, 160201, 160450 |
Karte von Arajuno
Interaktive Karte
Bevölkerung von Arajuno
Jahre 1975 bis 2030
| Data | 1975 | 1990 | 2000 | 2015 | 2020 | 2025* | 2030* |
|---|---|---|---|---|---|---|---|
| Bevölkerung | 1.092 | 2.005 | 2.872 | 4.555 | 5.218 | 5.825 | 6.413 |
| Bevölkerungsdichte | 2,1 / km² | 3,9 / km² | 5,5 / km² | 8,8 / km² | 10,1 / km² | 11,2 / km² | 12,4 / km² |
Bevölkerungsänderung in Arajuno von 2000 bis 2020
Anstieg um 81.7 % von 2000 bis 2020
| Standort | Änderung seit 1975 | Änderung seit 1990 | Änderung seit 2000 |
|---|---|---|---|
| Arajuno | +377.8% | +160.2% | +81.7% |
| Provinz Pastaza | — | — | — |
| Ecuador | — | — | — |
Medianalter von Arajuno
Medianalter: 16.3 Jahre
| Standort | Mittleres Alter | Durchschnittsalter (weiblich) | Durchschnittsalter (männlich) |
|---|---|---|---|
| Arajuno | 16.3 yrs | 15.4 yrs | 17.1 yrs |
| Provinz Pastaza | 20.5 yrs | 20.7 yrs | 20.3 yrs |
| Ecuador | 25.1 yrs | 25.6 yrs | 24.5 yrs |
Bevölkerungsdichte von Arajuno
Bevölkerungsdichte: 10,1 / km²
| Standort | Bevölkerung | Gebiet | Dichte |
|---|---|---|---|
| Arajuno | 5.218 | 518,8 km² | 10,1 / km² |
| Provinz Pastaza | 99.970 | 29.719,4 km² | 3,4 / km² |
| Ecuador | 15,8 million | 256.053,3 km² | 61,9 / km² |
Historische und prognostizierte Bevölkerung von Arajuno
Geschätzte Bevölkerung von 1860 bis 2100
- JRC (Gemeinsame Forschungsstelle der Europäischen Kommission) arbeitet an GHS built-up grid
- CIESIN (Center for International Earth Science Information Network)
- [Verknüpfung] Klein Goldewijk, K., Beusen, A., Doelman, J., and Stehfest, E.: Anthropogenic land use estimates for the Holocene – HYDE 3.2, Earth Syst. Sci. Data, 9, 927–953, https://doi.org/10.5194/essd-9-927-2017, 2017.
Human Development Index (HDI)
Statistischer zusammengesetzter Index der Lebenserwartung, der Bildung und des Pro-Kopf-Einkommens.
Bruttoinlandsprodukt (BIP) von Arajuno
BIP pro Kopf, KKP (konstante internationale $ von 2017)
| Data | 1990 | 1995 | 2000 | 2005 | 2010 | 2015 | 2020 | 2022 |
|---|---|---|---|---|---|---|---|---|
| BIP pro Kopf | $10.727 | $11.379 | $7.403 | $4.240 | $3.734 | $4.801 | $4.318 | $4.105 |
| BIP insgesamt | $21,4 Mio. | $27 Mio. | $20,5 Mio. | $13,9 Mio. | $14,4 Mio. | $21,6 Mio. | $22,4 Mio. | $22,2 Mio. |
CO2-Emissionen von Arajuno
Kohlendioxid (CO2) -Emissionen pro Kopf in Tonnen pro Jahr
| Standort | CO2-Emissionen | CO2-Emissionen pro Kopf | Intensität der CO2-Emissionen |
|---|---|---|---|
| Arajuno | 14,328 tn | 2.75 tn | 27.6 tons/km² |
| Provinz Pastaza | 273,578 tn | 2.74 tn | 9.2 tons/km² |
| Ecuador | 43,886,500 tn | 2.77 tn | 171.4 tons/km² |
| CO2-Emissionen 2013 (Tonnen/Jahr) | 14,328 tn |
| CO2-Emissionen 2013 (Tonnen/Jahr) pro Kopf | 2.75 tn |
| CO2-Emissionsintensität 2013 (Tonnen/km²/Jahr) | 27.6 tons/km² |
Naturgefahrenrisiko
Relatives Risiko von 10
| Gefahr | Risikostufe |
|---|---|
| Dürre | Hoch (8) |
| Flut | Mittel (4) |
| Erdbeben | Mittel (6) |
| Erdrutsch | Mittel (7) |
* Das Risiko, insbesondere in Bezug auf Überschwemmungen oder Erdrutsche, gilt möglicherweise nicht für das gesamte Gebiet.
- Dilley, M., R.S. Chen, U. Deichmann, A.L. Lerner-Lam, M. Arnold, J. Agwe, P. Buys, O. Kjekstad, B. Lyon, and G. Yetman. 2005. Natural Disaster Hotspots: A Global Risk Analysis. Washington, D.C.: World Bank. https://doi.org/10.1596/0-8213-5930-4.
- Center for Hazards and Risk Research - CHRR - Columbia University, Center for International Earth Science Information Network - CIESIN - Columbia University, and Norwegian Geotechnical Institute - NGI. 2005. Global Landslide Hazard Distribution. Palisades, NY: NASA Socioeconomic Data and Applications Center (SEDAC). https://doi.org/10.7927/H4P848VZ.
- Center for Hazards and Risk Research - CHRR - Columbia University, Center for International Earth Science Information Network - CIESIN - Columbia University, and International Research Institute for Climate and Society - IRI - Columbia University. 2005. Global Drought Hazard Frequency and Distribution. Palisades, NY: NASA Socioeconomic Data and Applications Center (SEDAC). https://doi.org/10.7927/H4VX0DFT.
- Center for Hazards and Risk Research - CHRR - Columbia University, Center for International Earth Science Information Network - CIESIN - Columbia University. 2005. Global Flood Hazard Frequency and Distribution. Palisades, NY: NASA Socioeconomic Data and Applications Center (SEDAC). https://doi.org/10.7927/H4668B3D.
- Center for Hazards and Risk Research - CHRR - Columbia University, Center for International Earth Science Information Network - CIESIN - Columbia University. 2005. Global Earthquake Hazard Distribution - Peak Ground Acceleration. Palisades, NY: NASA Socioeconomic Data and Applications Center (SEDAC). https://doi.org/10.7927/H4BZ63ZS.
Aktuelle Erdbeben in der Nähe
Magnitude 3.0 und höher
| Datum▼ | Zeit↕ | Magnitude↕ | Distance↕ | Tiefe↕ | Standort↕ | Verknüpfung |
|---|---|---|---|---|---|---|
| 6/11/19 | 9:25 PM | 4.4 | 15.1 km | 172,180 m | 29km ENE of Puyo, Ecuador | usgs.gov |
| 4/13/19 | 3:43 AM | 4.8 | 17.7 km | 175,490 m | 29km ENE of Puyo, Ecuador | usgs.gov |
| 1/25/19 | 9:49 AM | 4.5 | 24 km | 192,490 m | 52km SE of Tena, Ecuador | usgs.gov |
| 10/26/18 | 9:11 AM | 4.9 | 36.1 km | 163,660 m | 19km ESE of Puyo, Ecuador | usgs.gov |
| 7/2/18 | 1:16 AM | 4 | 15.6 km | 180,670 m | 40km ENE of Puyo, Ecuador | usgs.gov |
| 4/18/18 | 12:44 PM | 4.3 | 19.6 km | 178,790 m | 31km ENE of Puyo, Ecuador | usgs.gov |
| 10/23/17 | 5:08 PM | 4.4 | 16 km | 186,440 m | 45km SE of Tena, Ecuador | usgs.gov |
| 10/1/17 | 7:37 AM | 4.1 | 36.4 km | 198,120 m | 52km ENE of Palora, Ecuador | usgs.gov |
| 2/4/16 | 6:19 AM | 4.2 | 33.3 km | 172,850 m | 38km ENE of Palora, Ecuador | usgs.gov |
| 5/12/15 | 2:11 PM | 4.5 | 30.2 km | 172,120 m | 31km E of Puyo, Ecuador | usgs.gov |

Über unsere Daten
Die Daten auf dieser Seite werden anhand verschiedener öffentlich zugänglicher Werkzeuge und Quellen geschätzt. Sie werden ohne Gewähr bereitgestellt und können Ungenauigkeiten enthalten. Nutzung auf eigene Gefahr.