Kategorien in Quito
Branchen
Unternehmensverteilung nach Branche in Quito
| Branchenbeschreibung | Anzahl der Betriebe | Durchschnittsalter des Geschäfts |
|---|---|---|
| Restaurants | 13,792 | 21 years |
| Einkaufen | 8,750 | 24 years |
| Unternehmensleitung | 5,931 | 25 years |
| Lebensmittelläden und Supermärkte | 5,174 | 15 years |
| Autoreparatur | 4,713 | 24 years |
| Bekleidungsladen | 4,518 | 24 years |
| Erziehung und Unterricht | 3,820 | 31 years |
| Schönheitssalon | 3,248 | 15 years |
| Wohnungen | 2,863 | — |
| Sonstige Beherbergungsstätten | 2,802 | 20 years |
Quito Facts
| Gebiet | 295.9 km² |
| Bevölkerung | 1.918.000 |
| Männliche Bevölkerung | 928.273 (48.4%) |
| Weibliche Bevölkerung | 989.727 (51.6%) |
| Population change (1975 to 2020) | +179.4% |
| Population change (2000 to 2020) | +41.4% |
| Mittleres Alter | 27.3 years (Male: 26.4, Female: 28.1) |
| Vorwahlen | 2, 22 |
| Stadtviertel | Mariscal Sucre, Rumipamba, Jipijapa, La Carolina, Iñaquito |
| Zeit vor Ort | |
| Zeitzone | Ecuadorianische Zeit |
| Geogr. Länge & Breite | -0.22985, -78.52495 |
| Postleitzahlen | 170103, 170104, 170106, 170107, 170109, More |
Karte von Quito
Interaktive Karte
Bevölkerung von Quito
Jahre 1975 bis 2020
| Data | 1975 | 1990 | 2000 | 2015 | 2020 |
|---|---|---|---|---|---|
| Bevölkerung | 686.564 | 1.062.127 | 1.356.414 | 1.810.949 | 1.918.000 |
| Bevölkerungsdichte | 2.320 / km² | 3.589 / km² | 4.583,4 / km² | 6.119,4 / km² | 6.481,1 / km² |
Bevölkerungsänderung in Quito von 2000 bis 2015
Anstieg um 33.5 % von 2000 bis 2015
| Standort | Änderung seit 1975 | Änderung seit 1990 | Änderung seit 2000 |
|---|---|---|---|
| Quito | +163.8% | +70.5% | +33.5% |
| Provinz Pichincha | +164.6% | +71% | +33.7% |
| Ecuador | +131.1% | +58.1% | +27.9% |
Medianalter von Quito
Medianalter: 27.3 Jahre
| Standort | Mittleres Alter | Durchschnittsalter (weiblich) | Durchschnittsalter (männlich) |
|---|---|---|---|
| Quito | 27.3 yrs | 28.1 yrs | 26.4 yrs |
| Provinz Pichincha | 26.7 yrs | 27.4 yrs | 25.9 yrs |
| Ecuador | 25.1 yrs | 25.6 yrs | 24.5 yrs |
Bevölkerungsdichte von Quito
Bevölkerungsdichte: 6.481 / km²
| Standort | Bevölkerung | Gebiet | Dichte |
|---|---|---|---|
| Quito | 1,9 million | 295,9 km² | 6.481 / km² |
| Provinz Pichincha | 2,9 million | 9.537 km² | 306 / km² |
| Ecuador | 15,8 million | 256.053,3 km² | 61,9 / km² |
Historische und prognostizierte Bevölkerung von Quito
Geschätzte Bevölkerung von 1870 bis 2100
- JRC (Gemeinsame Forschungsstelle der Europäischen Kommission) arbeitet an GHS built-up grid
- CIESIN (Center for International Earth Science Information Network)
- [Verknüpfung] Klein Goldewijk, K., Beusen, A., Doelman, J., and Stehfest, E.: Anthropogenic land use estimates for the Holocene – HYDE 3.2, Earth Syst. Sci. Data, 9, 927–953, https://doi.org/10.5194/essd-9-927-2017, 2017.
Stadtteile in Quito
Prozentsatz der Unternehmen nach Stadtteil in Quito
Price Distribution
Geschäftsverteilung nach Preis für Quito
Human Development Index (HDI)
Statistischer zusammengesetzter Index der Lebenserwartung, der Bildung und des Pro-Kopf-Einkommens.
CO2-Emissionen von Quito
Kohlendioxid (CO2) -Emissionen pro Kopf in Tonnen pro Jahr
| Standort | CO2-Emissionen | CO2-Emissionen pro Kopf | Intensität der CO2-Emissionen |
|---|---|---|---|
| Quito | 8,230,391 tn | 4.29 tn | 27,811.2 tons/km² |
| Provinz Pichincha | 13,145,274 tn | 4.51 tn | 1,378.3 tons/km² |
| Ecuador | 43,886,500 tn | 2.77 tn | 171.4 tons/km² |
| CO2-Emissionen 2013 (Tonnen/Jahr) | 8,230,391 tn |
| CO2-Emissionen 2013 (Tonnen/Jahr) pro Kopf | 4.29 tn |
| CO2-Emissionsintensität 2013 (Tonnen/km²/Jahr) | 27,811.2 tons/km² |
Naturgefahrenrisiko
Relatives Risiko von 10
| Gefahr | Risikostufe |
|---|---|
| Dürre | Hoch (8) |
| Flut | Hoch (9) |
| Erdbeben | Hoch (8.8) |
| Erdrutsch | Hoch (10) |
| Vulkan | Hoch (8) |
* Das Risiko, insbesondere in Bezug auf Überschwemmungen oder Erdrutsche, gilt möglicherweise nicht für das gesamte Gebiet.
- Dilley, M., R.S. Chen, U. Deichmann, A.L. Lerner-Lam, M. Arnold, J. Agwe, P. Buys, O. Kjekstad, B. Lyon, and G. Yetman. 2005. Natural Disaster Hotspots: A Global Risk Analysis. Washington, D.C.: World Bank. https://doi.org/10.1596/0-8213-5930-4.
- Center for Hazards and Risk Research - CHRR - Columbia University, Center for International Earth Science Information Network - CIESIN - Columbia University, and Norwegian Geotechnical Institute - NGI. 2005. Global Landslide Hazard Distribution. Palisades, NY: NASA Socioeconomic Data and Applications Center (SEDAC). https://doi.org/10.7927/H4P848VZ.
- Center for Hazards and Risk Research - CHRR - Columbia University, Center for International Earth Science Information Network - CIESIN - Columbia University, and International Research Institute for Climate and Society - IRI - Columbia University. 2005. Global Drought Hazard Frequency and Distribution. Palisades, NY: NASA Socioeconomic Data and Applications Center (SEDAC). https://doi.org/10.7927/H4VX0DFT.
- Center for Hazards and Risk Research - CHRR - Columbia University, Center for International Earth Science Information Network - CIESIN - Columbia University. 2005. Global Flood Hazard Frequency and Distribution. Palisades, NY: NASA Socioeconomic Data and Applications Center (SEDAC). https://doi.org/10.7927/H4668B3D.
- Center for Hazards and Risk Research - CHRR - Columbia University, Center for International Earth Science Information Network - CIESIN - Columbia University. 2005. Global Volcano Hazard Frequency and Distribution. Palisades, NY: NASA Socioeconomic Data and Applications Center (SEDAC). https://doi.org/10.7927/H4BR8Q45.
- Center for Hazards and Risk Research - CHRR - Columbia University, Center for International Earth Science Information Network - CIESIN - Columbia University. 2005. Global Earthquake Hazard Distribution - Peak Ground Acceleration. Palisades, NY: NASA Socioeconomic Data and Applications Center (SEDAC). https://doi.org/10.7927/H4BZ63ZS.
Aktuelle Erdbeben in der Nähe
Magnitude 3.0 und höher
| Datum▼ | Zeit↕ | Magnitude↕ | Distance↕ | Tiefe↕ | Standort↕ | Verknüpfung |
|---|---|---|---|---|---|---|
| 12/15/18 | 9:11 PM | 4.9 | 68 km | 57,250 m | 66km W of Otavalo, Ecuador | usgs.gov |
| 9/20/18 | 5:54 PM | 4.3 | 92.5 km | 83,860 m | 17km NNE of La Mana, Ecuador | usgs.gov |
| 6/3/18 | 1:51 AM | 3.5 | 13.7 km | 22,280 m | 13km NE of Quito, Ecuador | usgs.gov |
| 5/22/18 | 1:36 PM | 5 | 81.1 km | 33,370 m | 28km NW of Cotacachi, Ecuador | usgs.gov |
| 4/3/18 | 1:15 AM | 4.3 | 4.5 km | 5,000 m | 4km N of Quito, Ecuador | usgs.gov |
| 10/23/17 | 9:40 AM | 3.5 | 90.7 km | 10,000 m | 26km NW of Santo Domingo de los Colorados, Ecuador | usgs.gov |
| 5/25/17 | 8:43 AM | 3.6 | 8.6 km | 10,000 m | 8km NE of Quito, Ecuador | usgs.gov |
| 9/5/16 | 12:22 AM | 4.7 | 23.8 km | 10,000 m | 23km ENE of Quito, Ecuador | usgs.gov |
| 8/9/16 | 4:23 AM | 4.4 | 23.4 km | 9,130 m | 22km NE of Sangolqui, Ecuador | usgs.gov |
| 1/1/16 | 5:15 PM | 4.8 | 83.1 km | 27,100 m | 59km WNW of Cotacachi, Ecuador | usgs.gov |
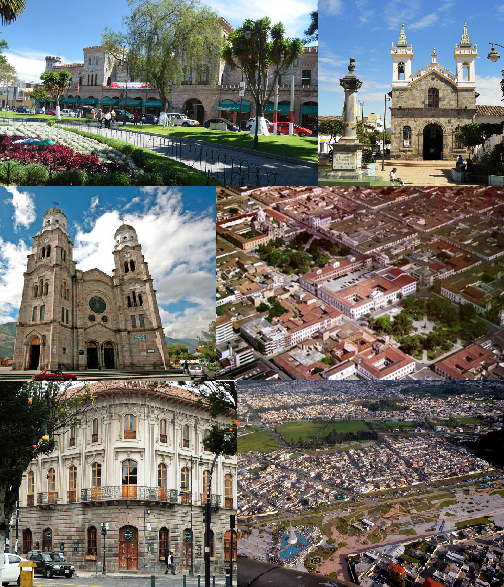
Quito
Quito (San Francisco de Quito) [ˈkito] ist die Hauptstadt von Ecuador und liegt 20 Kilometer südlich des Äquators in einem 2.850 m hohen Becken der Anden und ist somit noch vor der bolivianischen Hauptstadt Sucre die höchstgelegene Hauptstadt der Welt. Sie ist..
Quito Wikipedia-Seite


Über unsere Daten
Die Daten auf dieser Seite werden anhand verschiedener öffentlich zugänglicher Werkzeuge und Quellen geschätzt. Sie werden ohne Gewähr bereitgestellt und können Ungenauigkeiten enthalten. Nutzung auf eigene Gefahr.