Kategorien in Ambrolauri
Ambrolauri Facts
| Gebiet | 1246.4 km² |
| Bevölkerung | 10.185 |
| Männliche Bevölkerung | 5.136 (50.4%) |
| Weibliche Bevölkerung | 5.049 (49.6%) |
| Population change (1975 to 2020) | -59.0% |
| Population change (2000 to 2020) | -40.7% |
| Mittleres Alter | 33.9 years (Male: 32.4, Female: 35.6) |
| Vorwahlen | 439 |
| Zeit vor Ort | |
| Zeitzone | Georgische Normalzeit |
| Geogr. Länge & Breite | 42.52111, 43.16222 |
Karte von Ambrolauri
Interaktive Karte
Bevölkerung von Ambrolauri
Jahre 1975 bis 2020
| Data | 1975 | 1990 | 2000 | 2015 | 2020 |
|---|---|---|---|---|---|
| Bevölkerung | 24.847 | 23.021 | 17.165 | 10.993 | 10.185 |
| Bevölkerungsdichte | 19,9 / km² | 18,5 / km² | 13,8 / km² | 8,8 / km² | 8,2 / km² |
Bevölkerungsänderung in Ambrolauri von 2000 bis 2015
Rückgang um 36 % von 2000 bis 2015
| Standort | Änderung seit 1975 | Änderung seit 1990 | Änderung seit 2000 |
|---|---|---|---|
| Ambrolauri | -55.8% | -52.2% | -36% |
| Georgien | -18.5% | -26.8% | -15.7% |
Medianalter von Ambrolauri
Medianalter: 33.9 Jahre
| Standort | Mittleres Alter | Durchschnittsalter (weiblich) | Durchschnittsalter (männlich) |
|---|---|---|---|
| Ambrolauri | 33.9 yrs | 35.6 yrs | 32.4 yrs |
| Georgien | 33.9 yrs | 35.5 yrs | 32.4 yrs |
Bevölkerungsdichte von Ambrolauri
Bevölkerungsdichte: 8,2 / km²
| Standort | Bevölkerung | Gebiet | Dichte |
|---|---|---|---|
| Ambrolauri | 10.185 | 1.246,4 km² | 8,2 / km² |
| Georgien | 4 million | 69.429,3 km² | 57,4 / km² |
Historische und prognostizierte Bevölkerung von Ambrolauri
Geschätzte Bevölkerung von 0 bis 2100
- JRC (Gemeinsame Forschungsstelle der Europäischen Kommission) arbeitet an GHS built-up grid
- CIESIN (Center for International Earth Science Information Network)
- [Verknüpfung] Klein Goldewijk, K., Beusen, A., Doelman, J., and Stehfest, E.: Anthropogenic land use estimates for the Holocene – HYDE 3.2, Earth Syst. Sci. Data, 9, 927–953, https://doi.org/10.5194/essd-9-927-2017, 2017.
Human Development Index (HDI)
Statistischer zusammengesetzter Index der Lebenserwartung, der Bildung und des Pro-Kopf-Einkommens.
CO2-Emissionen von Ambrolauri
Kohlendioxid (CO2) -Emissionen pro Kopf in Tonnen pro Jahr
| Standort | CO2-Emissionen | CO2-Emissionen pro Kopf | Intensität der CO2-Emissionen |
|---|---|---|---|
| Ambrolauri | 28,643 tn | 2.81 tn | 23 tons/km² |
| Georgien | 11,940,990 tn | 2.99 tn | 172 tons/km² |
| CO2-Emissionen 2013 (Tonnen/Jahr) | 28,643 tn |
| CO2-Emissionen 2013 (Tonnen/Jahr) pro Kopf | 2.81 tn |
| CO2-Emissionsintensität 2013 (Tonnen/km²/Jahr) | 23 tons/km² |
Naturgefahrenrisiko
Relatives Risiko von 10
| Gefahr | Risikostufe |
|---|---|
| Flut | Mittel (4) |
| Erdbeben | Hoch (8) |
| Erdrutsch | Hoch (8) |
* Das Risiko, insbesondere in Bezug auf Überschwemmungen oder Erdrutsche, gilt möglicherweise nicht für das gesamte Gebiet.
- Dilley, M., R.S. Chen, U. Deichmann, A.L. Lerner-Lam, M. Arnold, J. Agwe, P. Buys, O. Kjekstad, B. Lyon, and G. Yetman. 2005. Natural Disaster Hotspots: A Global Risk Analysis. Washington, D.C.: World Bank. https://doi.org/10.1596/0-8213-5930-4.
- Center for Hazards and Risk Research - CHRR - Columbia University, Center for International Earth Science Information Network - CIESIN - Columbia University, and Norwegian Geotechnical Institute - NGI. 2005. Global Landslide Hazard Distribution. Palisades, NY: NASA Socioeconomic Data and Applications Center (SEDAC). https://doi.org/10.7927/H4P848VZ.
- Center for Hazards and Risk Research - CHRR - Columbia University, Center for International Earth Science Information Network - CIESIN - Columbia University. 2005. Global Flood Hazard Frequency and Distribution. Palisades, NY: NASA Socioeconomic Data and Applications Center (SEDAC). https://doi.org/10.7927/H4668B3D.
- Center for Hazards and Risk Research - CHRR - Columbia University, Center for International Earth Science Information Network - CIESIN - Columbia University. 2005. Global Earthquake Hazard Distribution - Peak Ground Acceleration. Palisades, NY: NASA Socioeconomic Data and Applications Center (SEDAC). https://doi.org/10.7927/H4BZ63ZS.
Aktuelle Erdbeben in der Nähe
Magnitude 3.0 und höher
| Datum▼ | Zeit↕ | Magnitude↕ | Distance↕ | Tiefe↕ | Standort↕ | Verknüpfung |
|---|---|---|---|---|---|---|
| 11/6/18 | 1:17 AM | 5 | 35.7 km | 10,000 m | 13km ESE of Oni, Georgia | usgs.gov |
| 10/28/18 | 9:03 AM | 4.2 | 72.5 km | 10,970 m | 9km NE of Borjomi, Georgia | usgs.gov |
| 6/29/18 | 5:30 AM | 4.4 | 36.9 km | 10,000 m | 12km NE of K'ut'aisi, Georgia | usgs.gov |
| 3/13/17 | 2:25 AM | 4.4 | 39.1 km | 12,480 m | 22km SE of Oni, Georgia | usgs.gov |
| 11/18/15 | 1:17 AM | 4.1 | 19.4 km | 3,500 m | 3km NE of Tqibuli, Georgia | usgs.gov |
| 1/30/15 | 1:56 AM | 4 | 25.3 km | 10,510 m | 8km SE of Tqibuli, Georgia | usgs.gov |
| 10/8/14 | 12:36 PM | 4 | 23 km | 10,000 m | 9km ESE of Tqibuli, Georgia | usgs.gov |
| 8/18/11 | 11:57 AM | 4.8 | 20 km | 10,000 m | Georgia (Sak'art'velo) | usgs.gov |
| 1/19/11 | 9:51 AM | 4.1 | 71 km | 10,000 m | Georgia (Sak'art'velo) | usgs.gov |
| 4/12/10 | 2:43 AM | 4.1 | 22.9 km | 10,000 m | Georgia (Sak'art'velo) | usgs.gov |
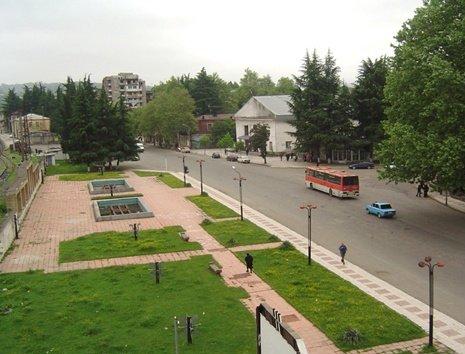
Ambrolauri
Ambrolauri (georgisch ამბროლაური) ist die Hauptstadt der georgischen Region Ratscha-Letschchumi und Niederswanetien und zugleich Verwaltungszentrum der gleichnamigen Munizipalität Ambrolauri. Sie hat etwa 2400 Einwohner (2009).
Ambrolauri Wikipedia-Seite


Über unsere Daten
Die Daten auf dieser Seite werden anhand verschiedener öffentlich zugänglicher Werkzeuge und Quellen geschätzt. Sie werden ohne Gewähr bereitgestellt und können Ungenauigkeiten enthalten. Nutzung auf eigene Gefahr.