Kategorien in Les Abymes
Branchen
Unternehmensverteilung nach Branche in Les Abymes
| Branchenbeschreibung | Anzahl der Betriebe | Durchschnittsalter des Geschäfts |
|---|---|---|
| Restaurants | 107 | 13 years |
| Autoreparatur | 59 | 14 years |
| Erziehung und Unterricht | 53 | 20 years |
| Sonstige Beherbergungsstätten | 52 | — |
| Einkaufen | 52 | — |
| Unternehmensleitung | 50 | 16 years |
| Wohnungen | 47 | — |
| Autovermietung | 46 | 20 years |
| Schönheitssalon | 45 | 16 years |
| Bildung andere | 37 | — |
| Öffentliche Verwaltung | 37 | — |
| Gesundheit und Medizin | 29 | — |
Les Abymes Facts
| Gebiet | 59.3 km² |
| Bevölkerung | 58.456 |
| Männliche Bevölkerung | 26.064 (44.6%) |
| Weibliche Bevölkerung | 32.392 (55.4%) |
| Population change (1975 to 2020) | -7.1% |
| Population change (2000 to 2020) | -8.5% |
| Mittleres Alter | 35.5 years (Male: 31.9, Female: 37.5) |
| Stadtviertel | Raizet, Grand Camp |
| Zeit vor Ort | |
| Zeitzone | Atlantik-Normalzeit |
| Geogr. Länge & Breite | 16.27095, -61.50451 |
| Postleitzahlen | 97139, 97142, 97178 CEDEX, 97183 CEDEX, 97185 CEDEX, More |
Karte von Les Abymes
Interaktive Karte
Bevölkerung von Les Abymes
Jahre 1975 bis 2020
| Data | 1975 | 1990 | 2000 | 2015 | 2020 |
|---|---|---|---|---|---|
| Bevölkerung | 62.902 | 64.824 | 63.863 | 56.670 | 58.456 |
| Bevölkerungsdichte | 1.061,6 / km² | 1.094,1 / km² | 1.077,9 / km² | 956,5 / km² | 986,6 / km² |
Bevölkerungsänderung in Les Abymes von 2000 bis 2015
Rückgang um 11.3 % von 2000 bis 2015
| Standort | Änderung seit 1975 | Änderung seit 1990 | Änderung seit 2000 |
|---|---|---|---|
| Les Abymes | -9.9% | -12.6% | -11.3% |
| Guadeloupe | +42.5% | +19.5% | +8% |
Medianalter von Les Abymes
Medianalter: 35.5 Jahre
| Standort | Mittleres Alter | Durchschnittsalter (weiblich) | Durchschnittsalter (männlich) |
|---|---|---|---|
| Les Abymes | 35.5 yrs | 37.5 yrs | 31.9 yrs |
| Guadeloupe | 37.8 yrs | 38.9 yrs | 36.3 yrs |
Bevölkerungsdichte von Les Abymes
Bevölkerungsdichte: 987 / km²
| Standort | Bevölkerung | Gebiet | Dichte |
|---|---|---|---|
| Les Abymes | 58.456 | 59,3 km² | 987 / km² |
| Guadeloupe | 361.115 | 1.668,9 km² | 216 / km² |
Historische und prognostizierte Bevölkerung von Les Abymes
Geschätzte Bevölkerung von 0 bis 2100
- JRC (Gemeinsame Forschungsstelle der Europäischen Kommission) arbeitet an GHS built-up grid
- CIESIN (Center for International Earth Science Information Network)
- [Verknüpfung] Klein Goldewijk, K., Beusen, A., Doelman, J., and Stehfest, E.: Anthropogenic land use estimates for the Holocene – HYDE 3.2, Earth Syst. Sci. Data, 9, 927–953, https://doi.org/10.5194/essd-9-927-2017, 2017.
Price Distribution
Geschäftsverteilung nach Preis für Les Abymes
Human Development Index (HDI)
Statistischer zusammengesetzter Index der Lebenserwartung, der Bildung und des Pro-Kopf-Einkommens.
CO2-Emissionen von Les Abymes
Kohlendioxid (CO2) -Emissionen pro Kopf in Tonnen pro Jahr
| Standort | CO2-Emissionen | CO2-Emissionen pro Kopf | Intensität der CO2-Emissionen |
|---|---|---|---|
| Les Abymes | 351,305 tn | 6.01 tn | 5,929.2 tons/km² |
| Guadeloupe | 1,866,743 tn | 5.17 tn | 1,118.5 tons/km² |
| CO2-Emissionen 2013 (Tonnen/Jahr) | 351,305 tn |
| CO2-Emissionen 2013 (Tonnen/Jahr) pro Kopf | 6.01 tn |
| CO2-Emissionsintensität 2013 (Tonnen/km²/Jahr) | 5,929.2 tons/km² |
Naturgefahrenrisiko
Relatives Risiko von 10
| Gefahr | Risikostufe |
|---|---|
| Dürre | Mittel (4) |
| Flut | Mittel (4) |
| Erdbeben | Mittel (7) |
| Zyklon | Hoch (8) |
| Vulkan | Mittel (6) |
* Das Risiko, insbesondere in Bezug auf Überschwemmungen oder Erdrutsche, gilt möglicherweise nicht für das gesamte Gebiet.
- Dilley, M., R.S. Chen, U. Deichmann, A.L. Lerner-Lam, M. Arnold, J. Agwe, P. Buys, O. Kjekstad, B. Lyon, and G. Yetman. 2005. Natural Disaster Hotspots: A Global Risk Analysis. Washington, D.C.: World Bank. https://doi.org/10.1596/0-8213-5930-4.
- Center for Hazards and Risk Research - CHRR - Columbia University, Center for International Earth Science Information Network - CIESIN - Columbia University, International Bank for Reconstruction and Development - The World Bank, and United Nations Environment Programme Global Resource Information Database Geneva - UNEP/GRID-Geneva. 2005. Global Cyclone Hazard Frequency and Distribution. Palisades, NY: NASA Socioeconomic Data and Applications Center (SEDAC). https://doi.org/10.7927/H4CZ353K.
- Center for Hazards and Risk Research - CHRR - Columbia University, Center for International Earth Science Information Network - CIESIN - Columbia University, and International Research Institute for Climate and Society - IRI - Columbia University. 2005. Global Drought Hazard Frequency and Distribution. Palisades, NY: NASA Socioeconomic Data and Applications Center (SEDAC). https://doi.org/10.7927/H4VX0DFT.
- Center for Hazards and Risk Research - CHRR - Columbia University, Center for International Earth Science Information Network - CIESIN - Columbia University. 2005. Global Flood Hazard Frequency and Distribution. Palisades, NY: NASA Socioeconomic Data and Applications Center (SEDAC). https://doi.org/10.7927/H4668B3D.
- Center for Hazards and Risk Research - CHRR - Columbia University, Center for International Earth Science Information Network - CIESIN - Columbia University. 2005. Global Volcano Hazard Frequency and Distribution. Palisades, NY: NASA Socioeconomic Data and Applications Center (SEDAC). https://doi.org/10.7927/H4BR8Q45.
- Center for Hazards and Risk Research - CHRR - Columbia University, Center for International Earth Science Information Network - CIESIN - Columbia University. 2005. Global Earthquake Hazard Distribution - Peak Ground Acceleration. Palisades, NY: NASA Socioeconomic Data and Applications Center (SEDAC). https://doi.org/10.7927/H4BZ63ZS.
Aktuelle Erdbeben in der Nähe
Magnitude 3.0 und höher
| Datum▼ | Zeit↕ | Magnitude↕ | Distance↕ | Tiefe↕ | Standort↕ | Verknüpfung |
|---|---|---|---|---|---|---|
| 4/28/18 | 12:15 AM | 3.6 | 38.1 km | 10,000 m | 1km NW of Baillif, Guadeloupe | usgs.gov |
| 1/9/18 | 9:50 PM | 4.1 | 34 km | 123,740 m | 14km SE of Capesterre-Belle-Eau, Guadeloupe | usgs.gov |
| 10/25/16 | 6:45 PM | 4.6 | 5 km | 90,770 m | 4km SE of Les Abymes, Guadeloupe | usgs.gov |
| 2/18/16 | 8:41 AM | 4.3 | 41.9 km | 71,900 m | 20km NNE of Anse-Bertrand, Guadeloupe | usgs.gov |
| 1/31/16 | 4:42 PM | 4.8 | 26.8 km | 115,270 m | 5km WNW of Capesterre-Belle-Eau, Guadeloupe | usgs.gov |
| 12/23/15 | 3:21 AM | 4.4 | 25.7 km | 144,170 m | 5km ESE of Pointe-Noire, Guadeloupe | usgs.gov |
| 12/19/14 | 7:49 PM | 5.6 | 33.6 km | 118,070 m | 4km SSW of Pointe-Noire, Guadeloupe | usgs.gov |
| 1/10/14 | 3:14 AM | 4.5 | 46.2 km | 178,600 m | 15km WSW of Pointe-Noire, Guadeloupe | usgs.gov |
| 10/16/12 | 7:03 PM | 4.2 | 37.8 km | 177,800 m | Guadeloupe region, Leeward Islands | usgs.gov |
| 8/20/08 | 9:26 AM | 3.2 | 21.1 km | 32,000 m | Guadeloupe region, Leeward Islands | usgs.gov |
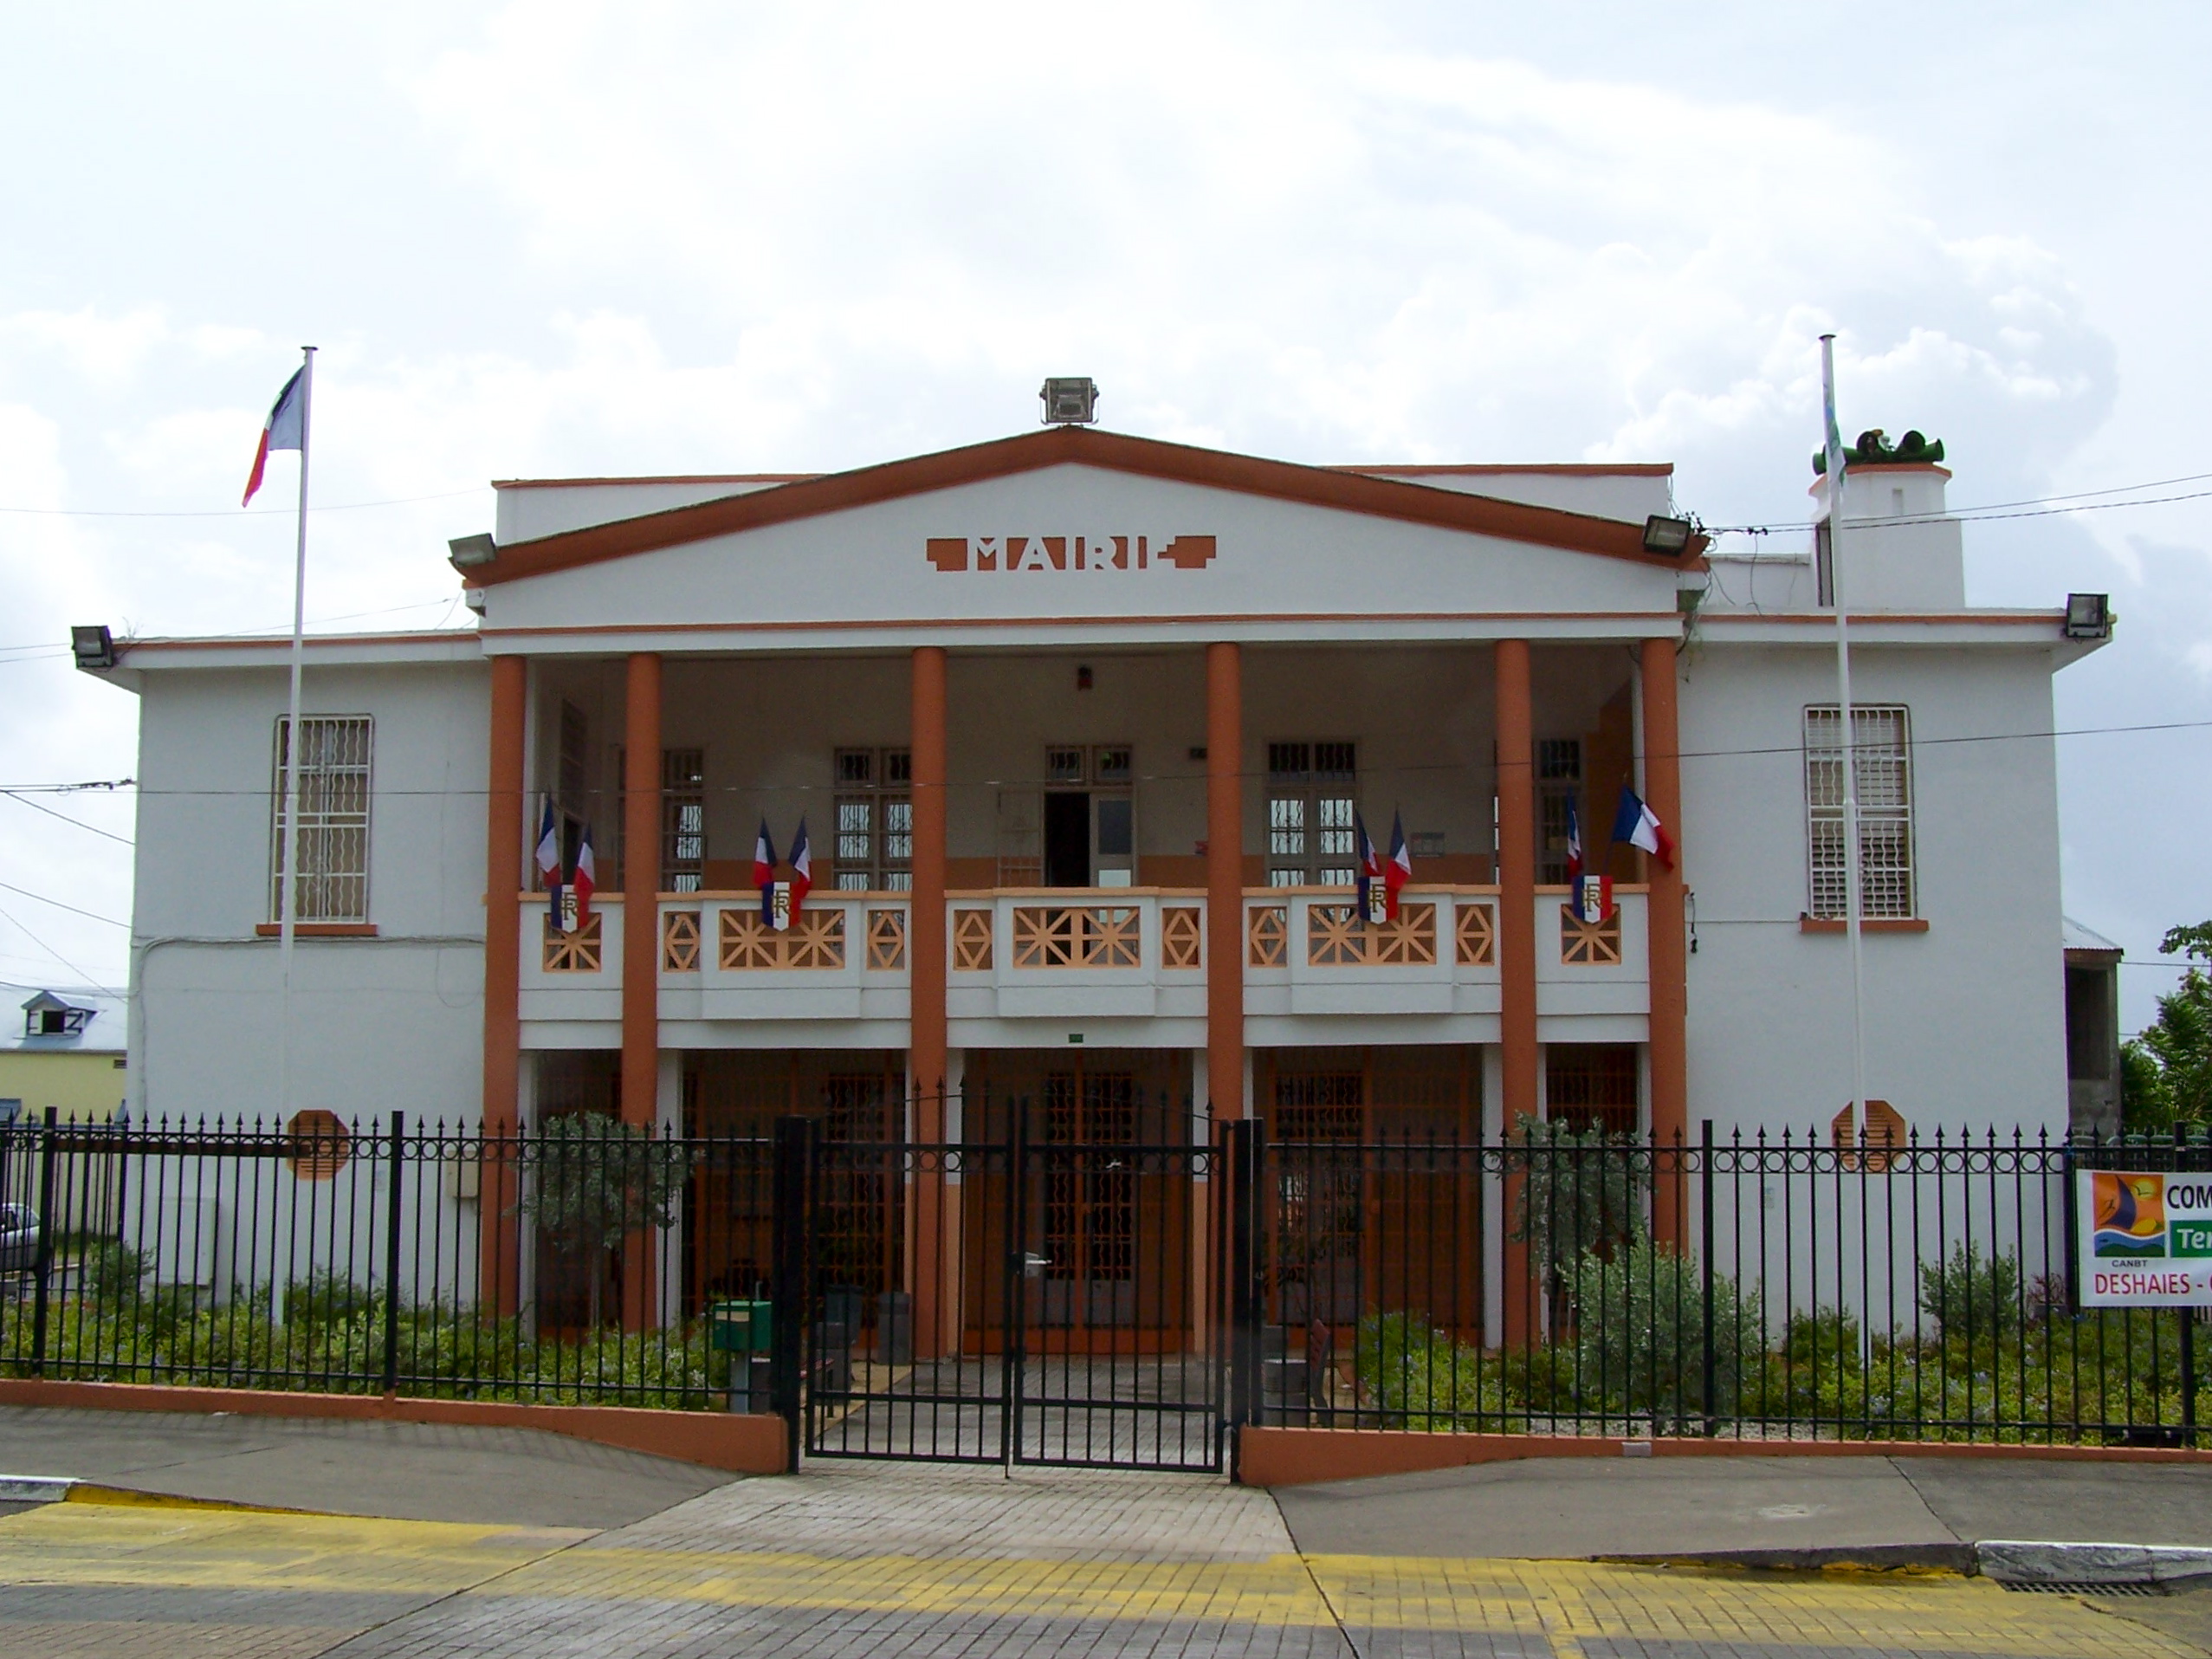
Les Abymes
Les Abymes ist eine Gemeinde mit 57.960 Einwohnern (Stand 1. Januar 2013) im französischen Überseedépartement Guadeloupe. Sie liegt in der Agglomeration um Pointe-à-Pitre und ist der Hauptort von fünf Kantonen. Sie sind alle nach Les Abymes benannt und von 1 b..
Les Abymes Wikipedia-Seite


Über unsere Daten
Die Daten auf dieser Seite werden anhand verschiedener öffentlich zugänglicher Werkzeuge und Quellen geschätzt. Sie werden ohne Gewähr bereitgestellt und können Ungenauigkeiten enthalten. Nutzung auf eigene Gefahr.