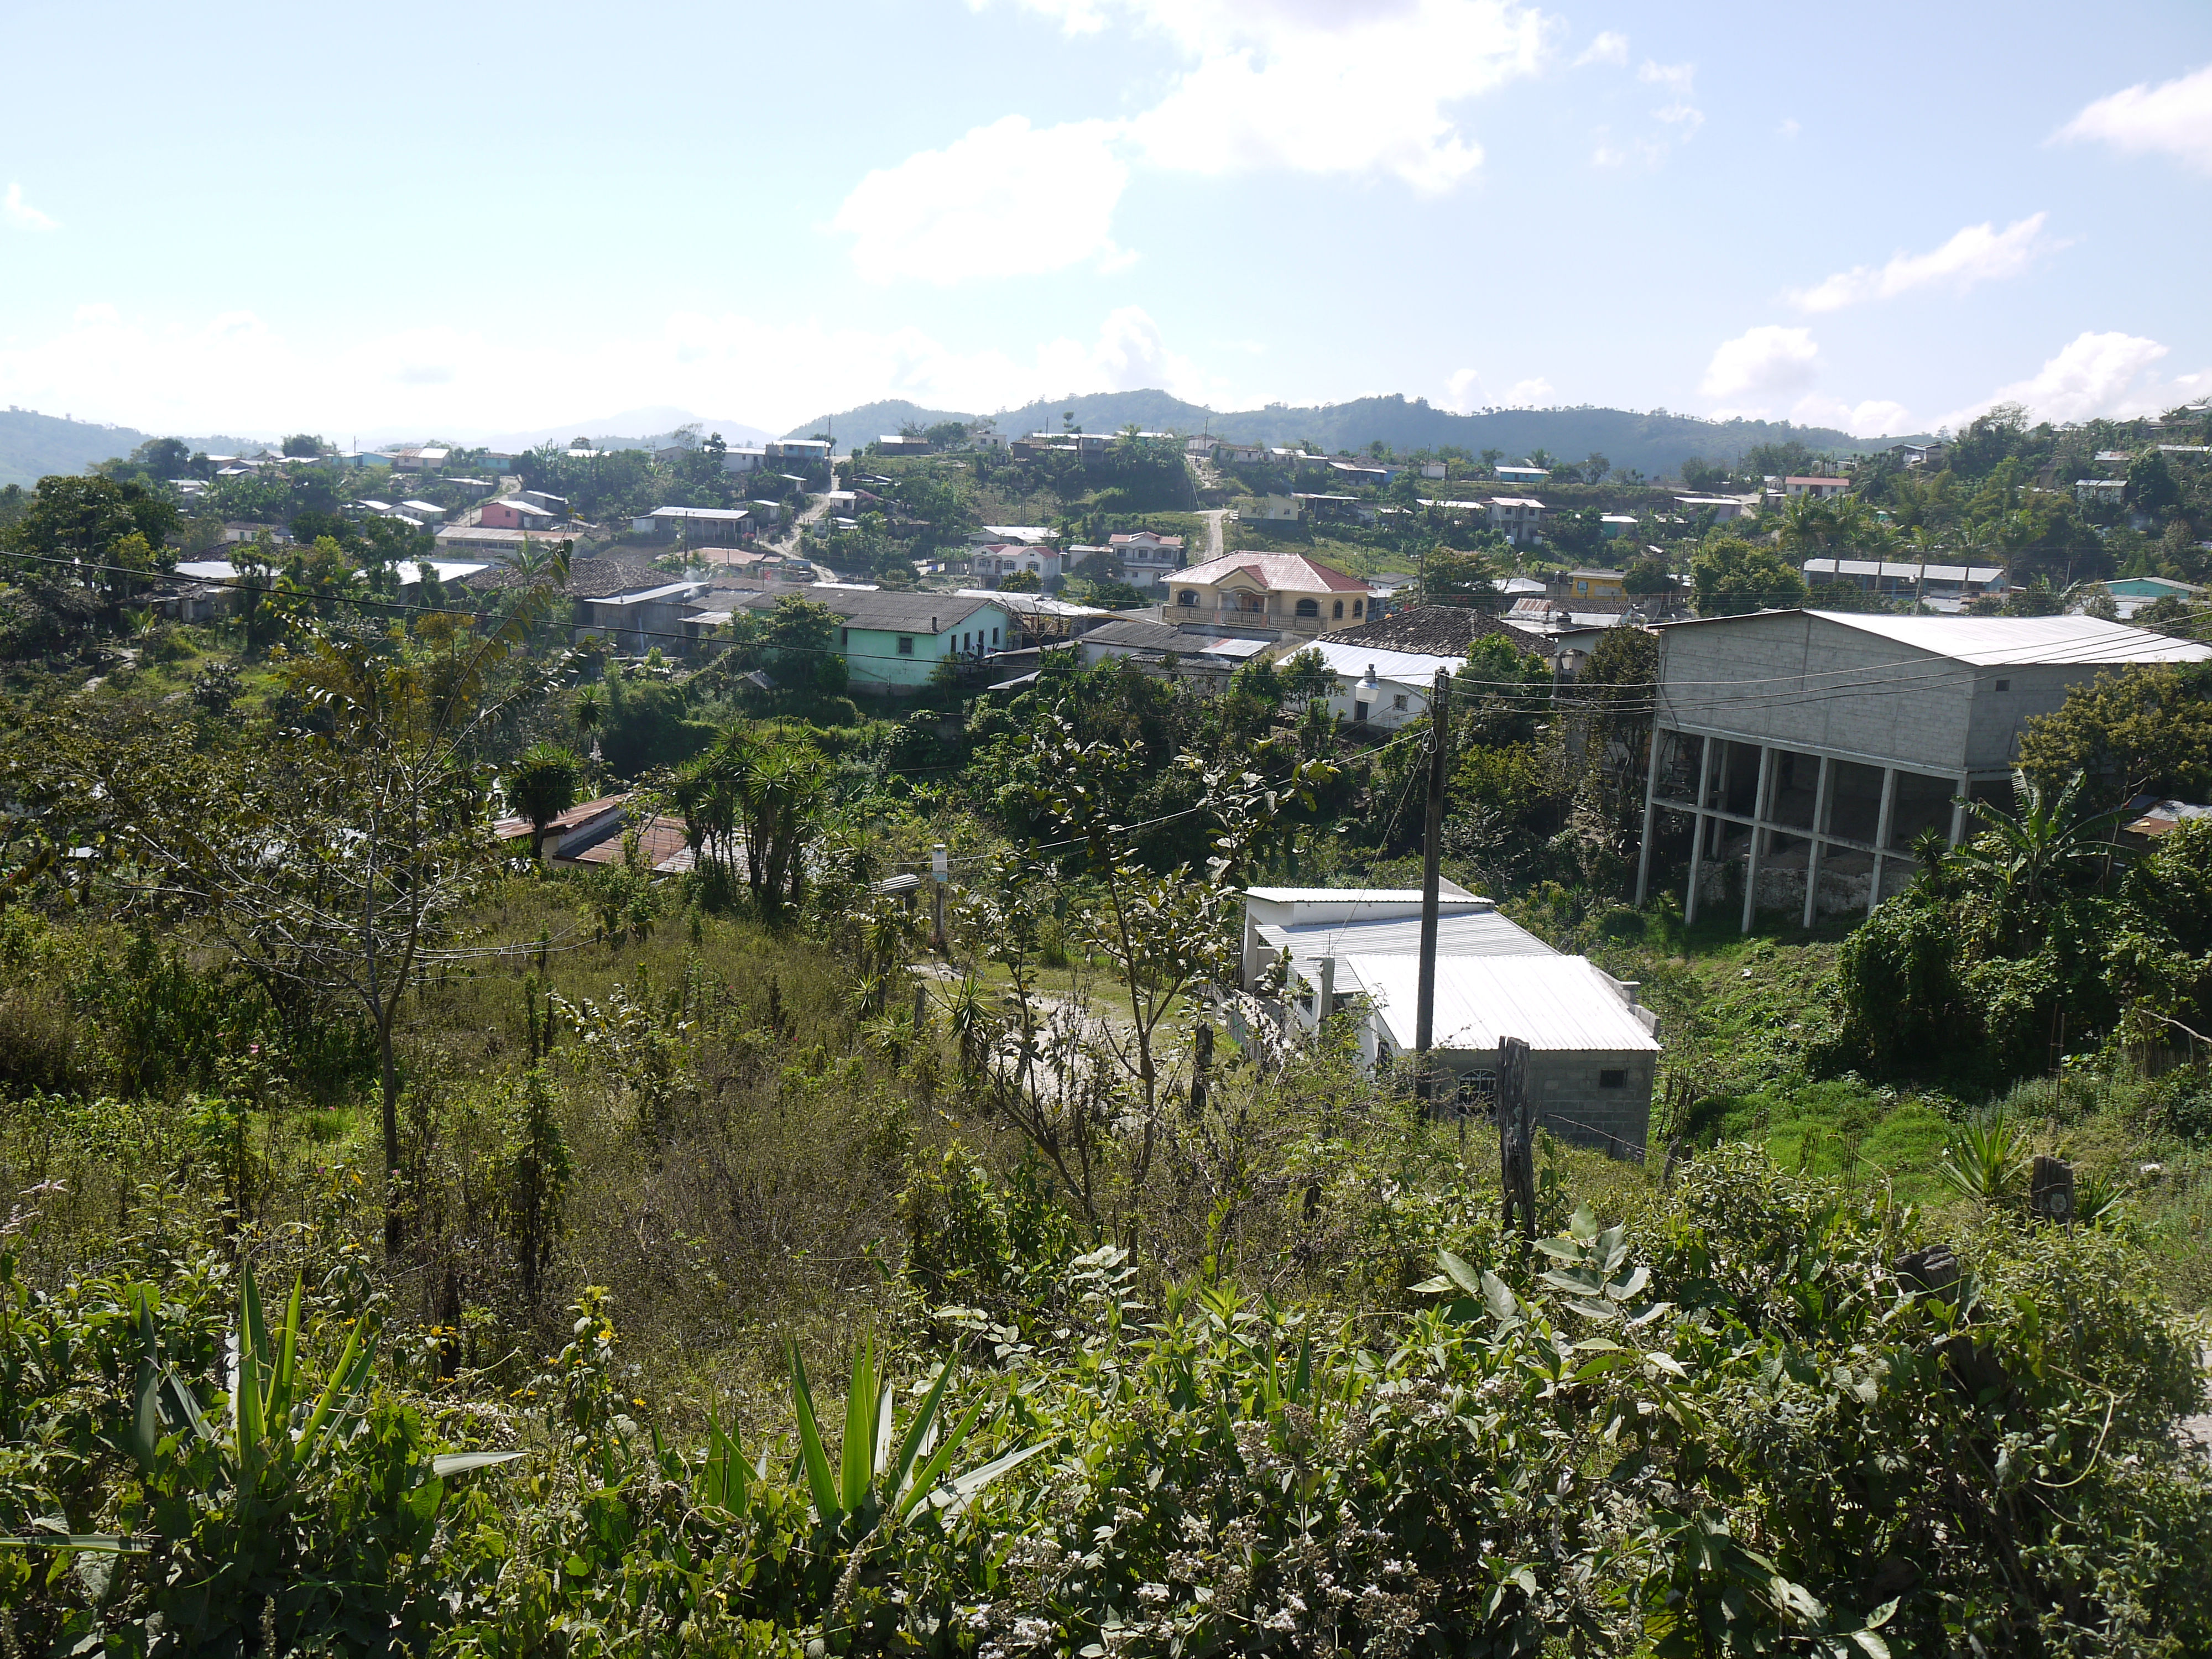
Florida Facts
| Gebiet | 288.9 km² |
| Bevölkerung | 30.887 |
| Männliche Bevölkerung | 15.261 (49.4%) |
| Weibliche Bevölkerung | 15.626 (50.6%) |
| Population change (1975 to 2020) | +69.0% |
| Population change (2000 to 2020) | +16.4% |
| Mittleres Alter | 18.6 years (Male: 18.1, Female: 19.1) |
| BIP pro Kopf (KKP) | $7.759 (2022) |
| Zeit vor Ort | |
| Zeitzone | Nordamerikanische Zentral-Normalzeit |
| Geogr. Länge & Breite | 15.03333, -88.83333 |
Karte von Florida
Interaktive Karte
Bevölkerung von Florida
Jahre 1975 bis 2030
| Data | 1975 | 1990 | 2000 | 2015 | 2020 | 2025* | 2030* |
|---|---|---|---|---|---|---|---|
| Bevölkerung | 18.276 | 23.806 | 26.542 | 27.475 | 30.887 | 33.408 | 36.261 |
| Bevölkerungsdichte | 63,3 / km² | 82,4 / km² | 91,9 / km² | 95,1 / km² | 106,9 / km² | 115,6 / km² | 125,5 / km² |
Bevölkerungsänderung in Florida von 2000 bis 2020
Anstieg um 16.4 % von 2000 bis 2020
| Standort | Änderung seit 1975 | Änderung seit 1990 | Änderung seit 2000 |
|---|---|---|---|
| Florida | +69% | +29.7% | +16.4% |
| Departamento Copán | — | — | — |
| Honduras | — | — | — |
Medianalter von Florida
Medianalter: 18.6 Jahre
| Standort | Mittleres Alter | Durchschnittsalter (weiblich) | Durchschnittsalter (männlich) |
|---|---|---|---|
| Florida | 18.6 yrs | 19.1 yrs | 18.1 yrs |
| Departamento Copán | 19.9 yrs | 20.7 yrs | 19.2 yrs |
| Honduras | 21.3 yrs | 22.1 yrs | 20.4 yrs |
Bevölkerungsdichte von Florida
Bevölkerungsdichte: 107 / km²
| Standort | Bevölkerung | Gebiet | Dichte |
|---|---|---|---|
| Florida | 30.887 | 288,9 km² | 107 / km² |
| Departamento Copán | 363.423 | 3.238,9 km² | 112 / km² |
| Honduras | 8 million | 112.208 km² | 71,1 / km² |
Historische und prognostizierte Bevölkerung von Florida
Geschätzte Bevölkerung von 0 bis 2100
- JRC (Gemeinsame Forschungsstelle der Europäischen Kommission) arbeitet an GHS built-up grid
- CIESIN (Center for International Earth Science Information Network)
- [Verknüpfung] Klein Goldewijk, K., Beusen, A., Doelman, J., and Stehfest, E.: Anthropogenic land use estimates for the Holocene – HYDE 3.2, Earth Syst. Sci. Data, 9, 927–953, https://doi.org/10.5194/essd-9-927-2017, 2017.
Human Development Index (HDI)
Statistischer zusammengesetzter Index der Lebenserwartung, der Bildung und des Pro-Kopf-Einkommens.
Bruttoinlandsprodukt (BIP) von Florida
BIP pro Kopf, KKP (konstante internationale $ von 2017)
| Data | 1990 | 1995 | 2000 | 2005 | 2010 | 2015 | 2020 | 2022 |
|---|---|---|---|---|---|---|---|---|
| BIP pro Kopf | $2.143 | $2.439 | $2.209 | $4.080 | $7.201 | $7.308 | $5.734 | $7.759 |
| BIP insgesamt | $18,3 Mio. | $23 Mio. | $22,6 Mio. | $45,8 Mio. | $86,6 Mio. | $92,9 Mio. | $76,2 Mio. | $108,8 Mio. |
CO2-Emissionen von Florida
Kohlendioxid (CO2) -Emissionen pro Kopf in Tonnen pro Jahr
| Standort | CO2-Emissionen | CO2-Emissionen pro Kopf | Intensität der CO2-Emissionen |
|---|---|---|---|
| Florida | 39,459 tn | 1.28 tn | 136.6 tons/km² |
| Departamento Copán | 465,095 tn | 1.28 tn | 143.6 tons/km² |
| Honduras | 10,597,427 tn | 1.33 tn | 94.4 tons/km² |
| CO2-Emissionen 2013 (Tonnen/Jahr) | 39,459 tn |
| CO2-Emissionen 2013 (Tonnen/Jahr) pro Kopf | 1.28 tn |
| CO2-Emissionsintensität 2013 (Tonnen/km²/Jahr) | 136.6 tons/km² |
Naturgefahrenrisiko
Relatives Risiko von 10
| Gefahr | Risikostufe |
|---|---|
| Flut | Hoch (8) |
| Erdbeben | Mittel (6.9) |
| Erdrutsch | Mittel (6) |
* Das Risiko, insbesondere in Bezug auf Überschwemmungen oder Erdrutsche, gilt möglicherweise nicht für das gesamte Gebiet.
- Dilley, M., R.S. Chen, U. Deichmann, A.L. Lerner-Lam, M. Arnold, J. Agwe, P. Buys, O. Kjekstad, B. Lyon, and G. Yetman. 2005. Natural Disaster Hotspots: A Global Risk Analysis. Washington, D.C.: World Bank. https://doi.org/10.1596/0-8213-5930-4.
- Center for Hazards and Risk Research - CHRR - Columbia University, Center for International Earth Science Information Network - CIESIN - Columbia University, and Norwegian Geotechnical Institute - NGI. 2005. Global Landslide Hazard Distribution. Palisades, NY: NASA Socioeconomic Data and Applications Center (SEDAC). https://doi.org/10.7927/H4P848VZ.
- Center for Hazards and Risk Research - CHRR - Columbia University, Center for International Earth Science Information Network - CIESIN - Columbia University. 2005. Global Flood Hazard Frequency and Distribution. Palisades, NY: NASA Socioeconomic Data and Applications Center (SEDAC). https://doi.org/10.7927/H4668B3D.
- Center for Hazards and Risk Research - CHRR - Columbia University, Center for International Earth Science Information Network - CIESIN - Columbia University. 2005. Global Earthquake Hazard Distribution - Peak Ground Acceleration. Palisades, NY: NASA Socioeconomic Data and Applications Center (SEDAC). https://doi.org/10.7927/H4BZ63ZS.
Aktuelle Erdbeben in der Nähe
Magnitude 3.0 und höher
| Datum▼ | Zeit↕ | Magnitude↕ | Distance↕ | Tiefe↕ | Standort↕ | Verknüpfung |
|---|---|---|---|---|---|---|
| 4/5/19 | 11:53 PM | 4.4 | 64.2 km | 10,000 m | 10km NNE of Sinuapa, Honduras | usgs.gov |
| 4/10/18 | 5:15 PM | 3.9 | 94.9 km | 10,000 m | 5km SSE of Panzos, Guatemala | usgs.gov |
| 2/9/18 | 10:19 AM | 4.2 | 32.4 km | 10,000 m | 19km SSW of Morales, Guatemala | usgs.gov |
| 9/17/17 | 5:56 AM | 4.3 | 76.6 km | 10,000 m | 20km NNW of Erandique, Honduras | usgs.gov |
| 11/28/16 | 6:37 AM | 4.4 | 74.8 km | 10,000 m | 13km WSW of Potrerillos, Honduras | usgs.gov |
| 1/31/15 | 11:40 AM | 4.6 | 64.4 km | 10,000 m | 10km NNE of Sinuapa, Honduras | usgs.gov |
| 1/30/15 | 3:01 PM | 4 | 69.6 km | 1,100 m | 6km N of Sinuapa, Honduras | usgs.gov |
| 2/5/14 | 12:23 AM | 4.1 | 24.6 km | 9,710 m | 3km N of El Corozal, Honduras | usgs.gov |
| 1/3/14 | 10:40 PM | 4.1 | 65.6 km | 180,310 m | 8km ESE of Sensenti, Honduras | usgs.gov |
| 5/29/13 | 4:24 AM | 4.2 | 50.3 km | 10,800 m | 7km SE of La Encarnacion, Honduras | usgs.gov |
Über unsere Daten
Die Daten auf dieser Seite werden anhand verschiedener öffentlich zugänglicher Werkzeuge und Quellen geschätzt. Sie werden ohne Gewähr bereitgestellt und können Ungenauigkeiten enthalten. Nutzung auf eigene Gefahr.