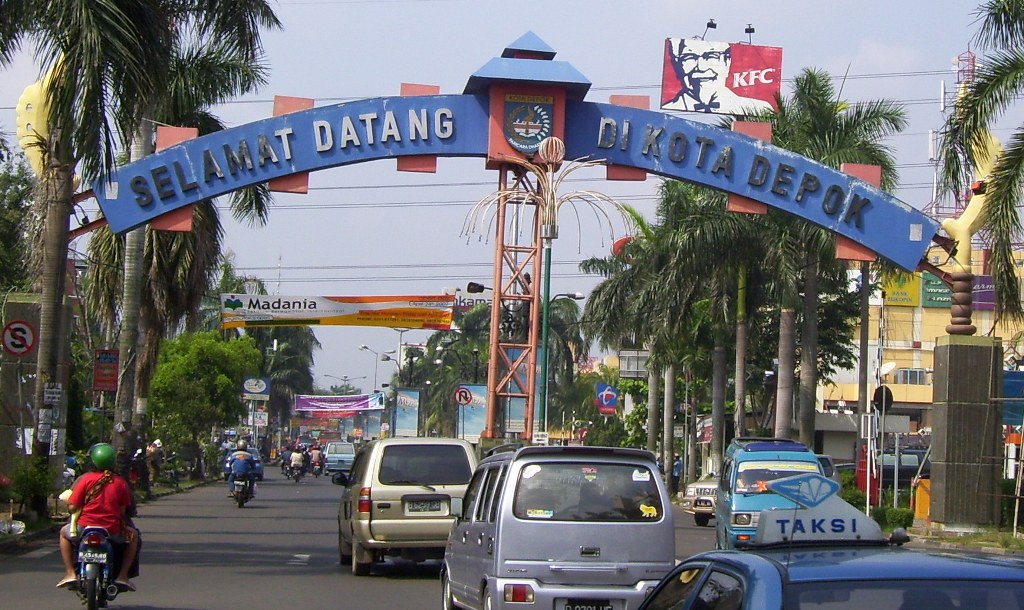
Kategorien in Puncak
Branchen
Unternehmensverteilung nach Branche in Puncak
| Branchenbeschreibung | Anzahl der Betriebe |
|---|---|
| Sonstige Beherbergungsstätten | 681 |
| Ferienhäuser, Hütten und Erholungsorte | 523 |
| Restaurants | 465 |
| Hotels und Motels | 284 |
| Einkaufen | 265 |
| Cafés | 208 |
| Religion | 152 |
| Erziehung und Unterricht | 129 |
| Moscheen | 110 |
| Lebensmittelläden und Supermärkte | 108 |
| Reisebüros | 83 |
| Reise und Transport | 72 |
Puncak Facts
| Gebiet | 74.0 km² |
| Bevölkerung | 281.991 |
| Männliche Bevölkerung | 145.032 (51.4%) |
| Weibliche Bevölkerung | 136.959 (48.6%) |
| Population change (1975 to 2020) | +170.6% |
| Population change (2000 to 2020) | +47.5% |
| Mittleres Alter | 24.7 years (Male: 24.8, Female: 24.6) |
| BIP pro Kopf (KKP) | $7.683 (2022) |
| Stadtviertel | Ciloto, Cipanas, Kalideres, Pasar Minggu, Kebon Jeruk, Penjaringan |
| Zeit vor Ort | |
| Zeitzone | Westindonesische Zeit |
| Geogr. Länge & Breite | -6.71083, 107.00028 |
| Postleitzahlen | 16750 |
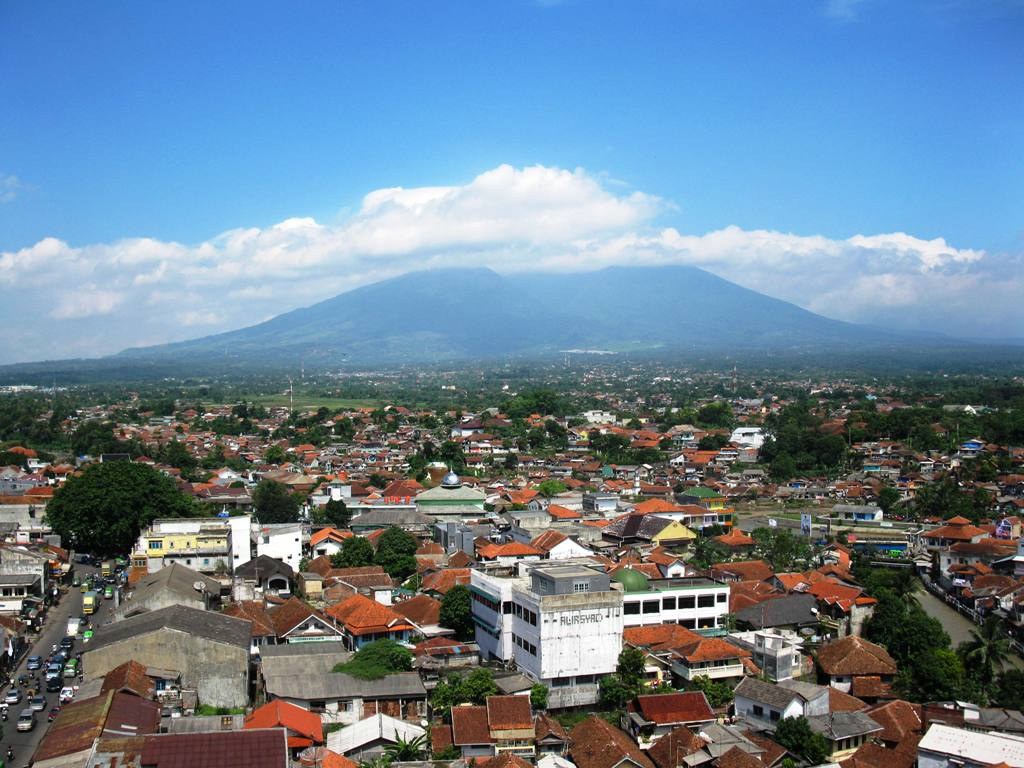
Karte von Puncak
Interaktive Karte
Bevölkerung von Puncak
Jahre 1975 bis 2030
| Data | 1975 | 1990 | 2000 | 2015 | 2020 | 2025* | 2030* |
|---|---|---|---|---|---|---|---|
| Bevölkerung | 104.206 | 124.216 | 191.241 | 245.499 | 281.991 | 279.800 | 281.205 |
| Bevölkerungsdichte | 1.408,2 / km² | 1.678,6 / km² | 2.584,3 / km² | 3.317,6 / km² | 3.810,7 / km² | 3.781,1 / km² | 3.800,1 / km² |
Bevölkerungsänderung in Puncak von 2000 bis 2020
Anstieg um 47.5 % von 2000 bis 2020
| Standort | Änderung seit 1975 | Änderung seit 1990 | Änderung seit 2000 |
|---|---|---|---|
| Puncak | +170.6% | +127% | +47.5% |
| Jawa Barat | — | — | — |
| Indonesien | — | — | — |
Medianalter von Puncak
Medianalter: 24.7 Jahre
| Standort | Mittleres Alter | Durchschnittsalter (weiblich) | Durchschnittsalter (männlich) |
|---|---|---|---|
| Puncak | 24.7 yrs | 24.6 yrs | 24.8 yrs |
| Jawa Barat | 26.2 yrs | 26.2 yrs | 26.2 yrs |
| Indonesien | 27.2 yrs | 27.5 yrs | 26.9 yrs |
Bevölkerungsdichte von Puncak
Bevölkerungsdichte: 3.811 / km²
| Standort | Bevölkerung | Gebiet | Dichte |
|---|---|---|---|
| Puncak | 281.991 | 74 km² | 3.811 / km² |
| Jawa Barat | 44.507 | 53,6 km² | 831 / km² |
| Indonesien | 252,8 million | 1.893.657,8 km² | 134 / km² |
Historische und prognostizierte Bevölkerung von Puncak
Geschätzte Bevölkerung von 1300 bis 2100
- JRC (Gemeinsame Forschungsstelle der Europäischen Kommission) arbeitet an GHS built-up grid
- CIESIN (Center for International Earth Science Information Network)
- [Verknüpfung] Klein Goldewijk, K., Beusen, A., Doelman, J., and Stehfest, E.: Anthropogenic land use estimates for the Holocene – HYDE 3.2, Earth Syst. Sci. Data, 9, 927–953, https://doi.org/10.5194/essd-9-927-2017, 2017.
Stadtteile in Puncak
Prozentsatz der Unternehmen nach Stadtteil in Puncak
Price Distribution
Geschäftsverteilung nach Preis für Puncak
Human Development Index (HDI)
Statistischer zusammengesetzter Index der Lebenserwartung, der Bildung und des Pro-Kopf-Einkommens.
Bruttoinlandsprodukt (BIP) von Puncak
BIP pro Kopf, KKP (konstante internationale $ von 2017)
| Data | 1990 | 1995 | 2000 | 2005 | 2010 | 2015 | 2020 | 2022 |
|---|---|---|---|---|---|---|---|---|
| BIP pro Kopf | $3.981 | $4.914 | $4.869 | $4.987 | $5.245 | $7.028 | $7.253 | $7.683 |
| BIP insgesamt | $293,8 Mio. | $461,2 Mio. | $583,9 Mio. | $700,8 Mio. | $864,9 Mio. | $1,3 Mrd. | $1,5 Mrd. | $1,6 Mrd. |
CO2-Emissionen von Puncak
Kohlendioxid (CO2) -Emissionen pro Kopf in Tonnen pro Jahr
| Standort | CO2-Emissionen | CO2-Emissionen pro Kopf | Intensität der CO2-Emissionen |
|---|---|---|---|
| Puncak | 609,435 tn | 2.16 tn | 8,235.6 tons/km² |
| Jawa Barat | 91,689 tn | 2.06 tn | 1,711.5 tons/km² |
| Indonesien | 478,610,416 tn | 1.89 tn | 252.7 tons/km² |
| CO2-Emissionen 2013 (Tonnen/Jahr) | 609,435 tn |
| CO2-Emissionen 2013 (Tonnen/Jahr) pro Kopf | 2.16 tn |
| CO2-Emissionsintensität 2013 (Tonnen/km²/Jahr) | 8,235.6 tons/km² |
Naturgefahrenrisiko
Relatives Risiko von 10
| Gefahr | Risikostufe |
|---|---|
| Dürre | Mittel (5) |
| Flut | Hoch (10) |
| Erdbeben | Mittel (7) |
| Erdrutsch | Hoch (9) |
| Vulkan | Hoch (9) |
* Das Risiko, insbesondere in Bezug auf Überschwemmungen oder Erdrutsche, gilt möglicherweise nicht für das gesamte Gebiet.
- Dilley, M., R.S. Chen, U. Deichmann, A.L. Lerner-Lam, M. Arnold, J. Agwe, P. Buys, O. Kjekstad, B. Lyon, and G. Yetman. 2005. Natural Disaster Hotspots: A Global Risk Analysis. Washington, D.C.: World Bank. https://doi.org/10.1596/0-8213-5930-4.
- Center for Hazards and Risk Research - CHRR - Columbia University, Center for International Earth Science Information Network - CIESIN - Columbia University, and Norwegian Geotechnical Institute - NGI. 2005. Global Landslide Hazard Distribution. Palisades, NY: NASA Socioeconomic Data and Applications Center (SEDAC). https://doi.org/10.7927/H4P848VZ.
- Center for Hazards and Risk Research - CHRR - Columbia University, Center for International Earth Science Information Network - CIESIN - Columbia University, and International Research Institute for Climate and Society - IRI - Columbia University. 2005. Global Drought Hazard Frequency and Distribution. Palisades, NY: NASA Socioeconomic Data and Applications Center (SEDAC). https://doi.org/10.7927/H4VX0DFT.
- Center for Hazards and Risk Research - CHRR - Columbia University, Center for International Earth Science Information Network - CIESIN - Columbia University. 2005. Global Flood Hazard Frequency and Distribution. Palisades, NY: NASA Socioeconomic Data and Applications Center (SEDAC). https://doi.org/10.7927/H4668B3D.
- Center for Hazards and Risk Research - CHRR - Columbia University, Center for International Earth Science Information Network - CIESIN - Columbia University. 2005. Global Volcano Hazard Frequency and Distribution. Palisades, NY: NASA Socioeconomic Data and Applications Center (SEDAC). https://doi.org/10.7927/H4BR8Q45.
- Center for Hazards and Risk Research - CHRR - Columbia University, Center for International Earth Science Information Network - CIESIN - Columbia University. 2005. Global Earthquake Hazard Distribution - Peak Ground Acceleration. Palisades, NY: NASA Socioeconomic Data and Applications Center (SEDAC). https://doi.org/10.7927/H4BZ63ZS.
Aktuelle Erdbeben in der Nähe
Magnitude 3.0 und höher
| Datum▼ | Zeit↕ | Magnitude↕ | Distance↕ | Tiefe↕ | Standort↕ | Verknüpfung |
|---|---|---|---|---|---|---|
| 3/19/19 | 5:04 AM | 4.5 | 23.6 km | 155,050 m | 9km NNW of Cibeber, Indonesia | usgs.gov |
| 3/27/18 | 8:57 PM | 4.5 | 57.4 km | 139,150 m | 0km NE of Serpong, Indonesia | usgs.gov |
| 12/12/17 | 2:23 AM | 5 | 47.1 km | 100,750 m | 1km SSW of Ciodeng, Indonesia | usgs.gov |
| 10/11/17 | 4:30 PM | 4.3 | 61.5 km | 95,750 m | 2km ESE of Cigaru, Indonesia | usgs.gov |
| 5/10/17 | 5:46 PM | 4.6 | 50.6 km | 121,110 m | 5km E of Sidoger Lebak, Indonesia | usgs.gov |
| 3/6/17 | 8:11 PM | 4.3 | 48.5 km | 61,550 m | 2km ESE of Cimapag, Indonesia | usgs.gov |
| 12/13/16 | 11:28 AM | 4.5 | 24.5 km | 123,640 m | 9km SSE of Cicurug, Indonesia | usgs.gov |
| 8/28/16 | 6:47 AM | 4.3 | 43.6 km | 96,480 m | 1km E of Cilandak, Indonesia | usgs.gov |
| 8/25/16 | 3:06 AM | 4.3 | 29.7 km | 178,370 m | 7km WSW of Sukabumi, Indonesia | usgs.gov |
| 7/24/16 | 4:56 PM | 4.2 | 60.2 km | 134,550 m | 5km N of Nagrak, Indonesia | usgs.gov |
Über unsere Daten
Die Daten auf dieser Seite werden anhand verschiedener öffentlich zugänglicher Werkzeuge und Quellen geschätzt. Sie werden ohne Gewähr bereitgestellt und können Ungenauigkeiten enthalten. Nutzung auf eigene Gefahr.