Branchen
Unternehmensverteilung nach Branche in Eilaboun
| Branchenbeschreibung | Anzahl der Betriebe |
|---|---|
| Restaurants | 16 |
Eilaboun Facts
| Gebiet | 1.8 km² |
| Bevölkerung | 3.313 |
| Männliche Bevölkerung | 1.727 (52.1%) |
| Weibliche Bevölkerung | 1.586 (47.9%) |
| Population change (1975 to 2020) | +173.6% |
| Population change (2000 to 2020) | +17.6% |
| Mittleres Alter | 24.4 years (Male: 24.4, Female: 24.3) |
| Zeit vor Ort | |
| Zeitzone | Israelische Sommerzeit |
| Geogr. Länge & Breite | 32.83693, 35.40029 |
| Postleitzahlen | 16972 |
Karte von Eilaboun
Interaktive Karte
Bevölkerung von Eilaboun
Jahre 1975 bis 2020
| Data | 1975 | 1990 | 2000 | 2015 | 2020 |
|---|---|---|---|---|---|
| Bevölkerung | 1.211 | 2.087 | 2.818 | 2.948 | 3.313 |
| Bevölkerungsdichte | 668,1 / km² | 1.151,4 / km² | 1.554,8 / km² | 1.626,5 / km² | 1.827,9 / km² |
Bevölkerungsänderung in Eilaboun von 2000 bis 2015
Anstieg um 4.6 % von 2000 bis 2015
| Standort | Änderung seit 1975 | Änderung seit 1990 | Änderung seit 2000 |
|---|---|---|---|
| Eilaboun | +143.4% | +41.3% | +4.6% |
| Nordbezirk (Israel) | +142.6% | +78.8% | +33.6% |
| Israel | +141.5% | +78.8% | +33.8% |
Medianalter von Eilaboun
Medianalter: 24.4 Jahre
| Standort | Mittleres Alter | Durchschnittsalter (weiblich) | Durchschnittsalter (männlich) |
|---|---|---|---|
| Eilaboun | 24.4 yrs | 24.3 yrs | 24.4 yrs |
| Nordbezirk (Israel) | 26.9 yrs | 27.7 yrs | 26.2 yrs |
| Israel | 29.5 yrs | 30.6 yrs | 28.5 yrs |
Bevölkerungsdichte von Eilaboun
Bevölkerungsdichte: 1.828 / km²
| Standort | Bevölkerung | Gebiet | Dichte |
|---|---|---|---|
| Eilaboun | 3.313 | 1,813 km² | 1.828 / km² |
| Nordbezirk (Israel) | 1,4 million | 4.641,2 km² | 304 / km² |
| Israel | 8,3 million | 22.078 km² | 374 / km² |
Historische und prognostizierte Bevölkerung von Eilaboun
Geschätzte Bevölkerung von 0 bis 2100
- JRC (Gemeinsame Forschungsstelle der Europäischen Kommission) arbeitet an GHS built-up grid
- CIESIN (Center for International Earth Science Information Network)
- [Verknüpfung] Klein Goldewijk, K., Beusen, A., Doelman, J., and Stehfest, E.: Anthropogenic land use estimates for the Holocene – HYDE 3.2, Earth Syst. Sci. Data, 9, 927–953, https://doi.org/10.5194/essd-9-927-2017, 2017.
Vorwahlen
Prozentuale Vorwahlen, die von Unternehmen in Eilaboun verwendet werden
Human Development Index (HDI)
Statistischer zusammengesetzter Index der Lebenserwartung, der Bildung und des Pro-Kopf-Einkommens.
CO2-Emissionen von Eilaboun
Kohlendioxid (CO2) -Emissionen pro Kopf in Tonnen pro Jahr
| Standort | CO2-Emissionen | CO2-Emissionen pro Kopf | Intensität der CO2-Emissionen |
|---|---|---|---|
| Eilaboun | 33,422 tn | 10.09 tn | 18,439.5 tons/km² |
| Nordbezirk (Israel) | 11,734,870 tn | 8.32 tn | 2,528.4 tons/km² |
| Israel | 81,985,471 tn | 9.92 tn | 3,713.4 tons/km² |
| CO2-Emissionen 2013 (Tonnen/Jahr) | 33,422 tn |
| CO2-Emissionen 2013 (Tonnen/Jahr) pro Kopf | 10.09 tn |
| CO2-Emissionsintensität 2013 (Tonnen/km²/Jahr) | 18,439.5 tons/km² |
Naturgefahrenrisiko
Relatives Risiko von 10
| Gefahr | Risikostufe |
|---|---|
| Dürre | Hoch (9) |
| Flut | Mittel (7) |
| Erdbeben | Mittel (7) |
* Das Risiko, insbesondere in Bezug auf Überschwemmungen oder Erdrutsche, gilt möglicherweise nicht für das gesamte Gebiet.
- Dilley, M., R.S. Chen, U. Deichmann, A.L. Lerner-Lam, M. Arnold, J. Agwe, P. Buys, O. Kjekstad, B. Lyon, and G. Yetman. 2005. Natural Disaster Hotspots: A Global Risk Analysis. Washington, D.C.: World Bank. https://doi.org/10.1596/0-8213-5930-4.
- Center for Hazards and Risk Research - CHRR - Columbia University, Center for International Earth Science Information Network - CIESIN - Columbia University, and International Research Institute for Climate and Society - IRI - Columbia University. 2005. Global Drought Hazard Frequency and Distribution. Palisades, NY: NASA Socioeconomic Data and Applications Center (SEDAC). https://doi.org/10.7927/H4VX0DFT.
- Center for Hazards and Risk Research - CHRR - Columbia University, Center for International Earth Science Information Network - CIESIN - Columbia University. 2005. Global Flood Hazard Frequency and Distribution. Palisades, NY: NASA Socioeconomic Data and Applications Center (SEDAC). https://doi.org/10.7927/H4668B3D.
- Center for Hazards and Risk Research - CHRR - Columbia University, Center for International Earth Science Information Network - CIESIN - Columbia University. 2005. Global Earthquake Hazard Distribution - Peak Ground Acceleration. Palisades, NY: NASA Socioeconomic Data and Applications Center (SEDAC). https://doi.org/10.7927/H4BZ63ZS.
Aktuelle Erdbeben in der Nähe
Magnitude 3.0 und höher
| Datum▼ | Zeit↕ | Magnitude↕ | Distance↕ | Tiefe↕ | Standort↕ | Verknüpfung |
|---|---|---|---|---|---|---|
| 7/4/18 | 7:45 PM | 4.7 | 6 km | 10,000 m | 5km SE of 'Eilabun, Israel | usgs.gov |
| 7/4/18 | 1:50 AM | 4 | 6.6 km | 10,000 m | 6km SSE of 'Eilabun, Israel | usgs.gov |
| 7/5/14 | 9:41 PM | 4 | 83.1 km | 12,700 m | 3km NE of Sidon, Lebanon | usgs.gov |
| 10/20/13 | 12:54 PM | 3.5 | 16.1 km | 5,000 m | 8km NNE of Tiberias, Israel | usgs.gov |
| 8/7/11 | 8:52 AM | 4.1 | 92.3 km | 31,000 m | Dead Sea region | usgs.gov |
| 7/10/09 | 6:19 PM | 4 | 52.1 km | 10,000 m | Lebanon - Syria region | usgs.gov |
| 8/13/08 | 6:05 AM | 3.2 | 82.9 km | 10,000 m | eastern Mediterranean Sea | usgs.gov |
| 7/2/08 | 9:29 AM | 3.1 | 66.9 km | 20,100 m | Lebanon - Syria region | usgs.gov |
| 6/23/08 | 3:45 PM | 3 | 50.3 km | 1,000 m | Lebanon - Syria region | usgs.gov |
| 6/13/08 | 5:28 AM | 4 | 53.8 km | 1,000 m | Lebanon - Syria region | usgs.gov |
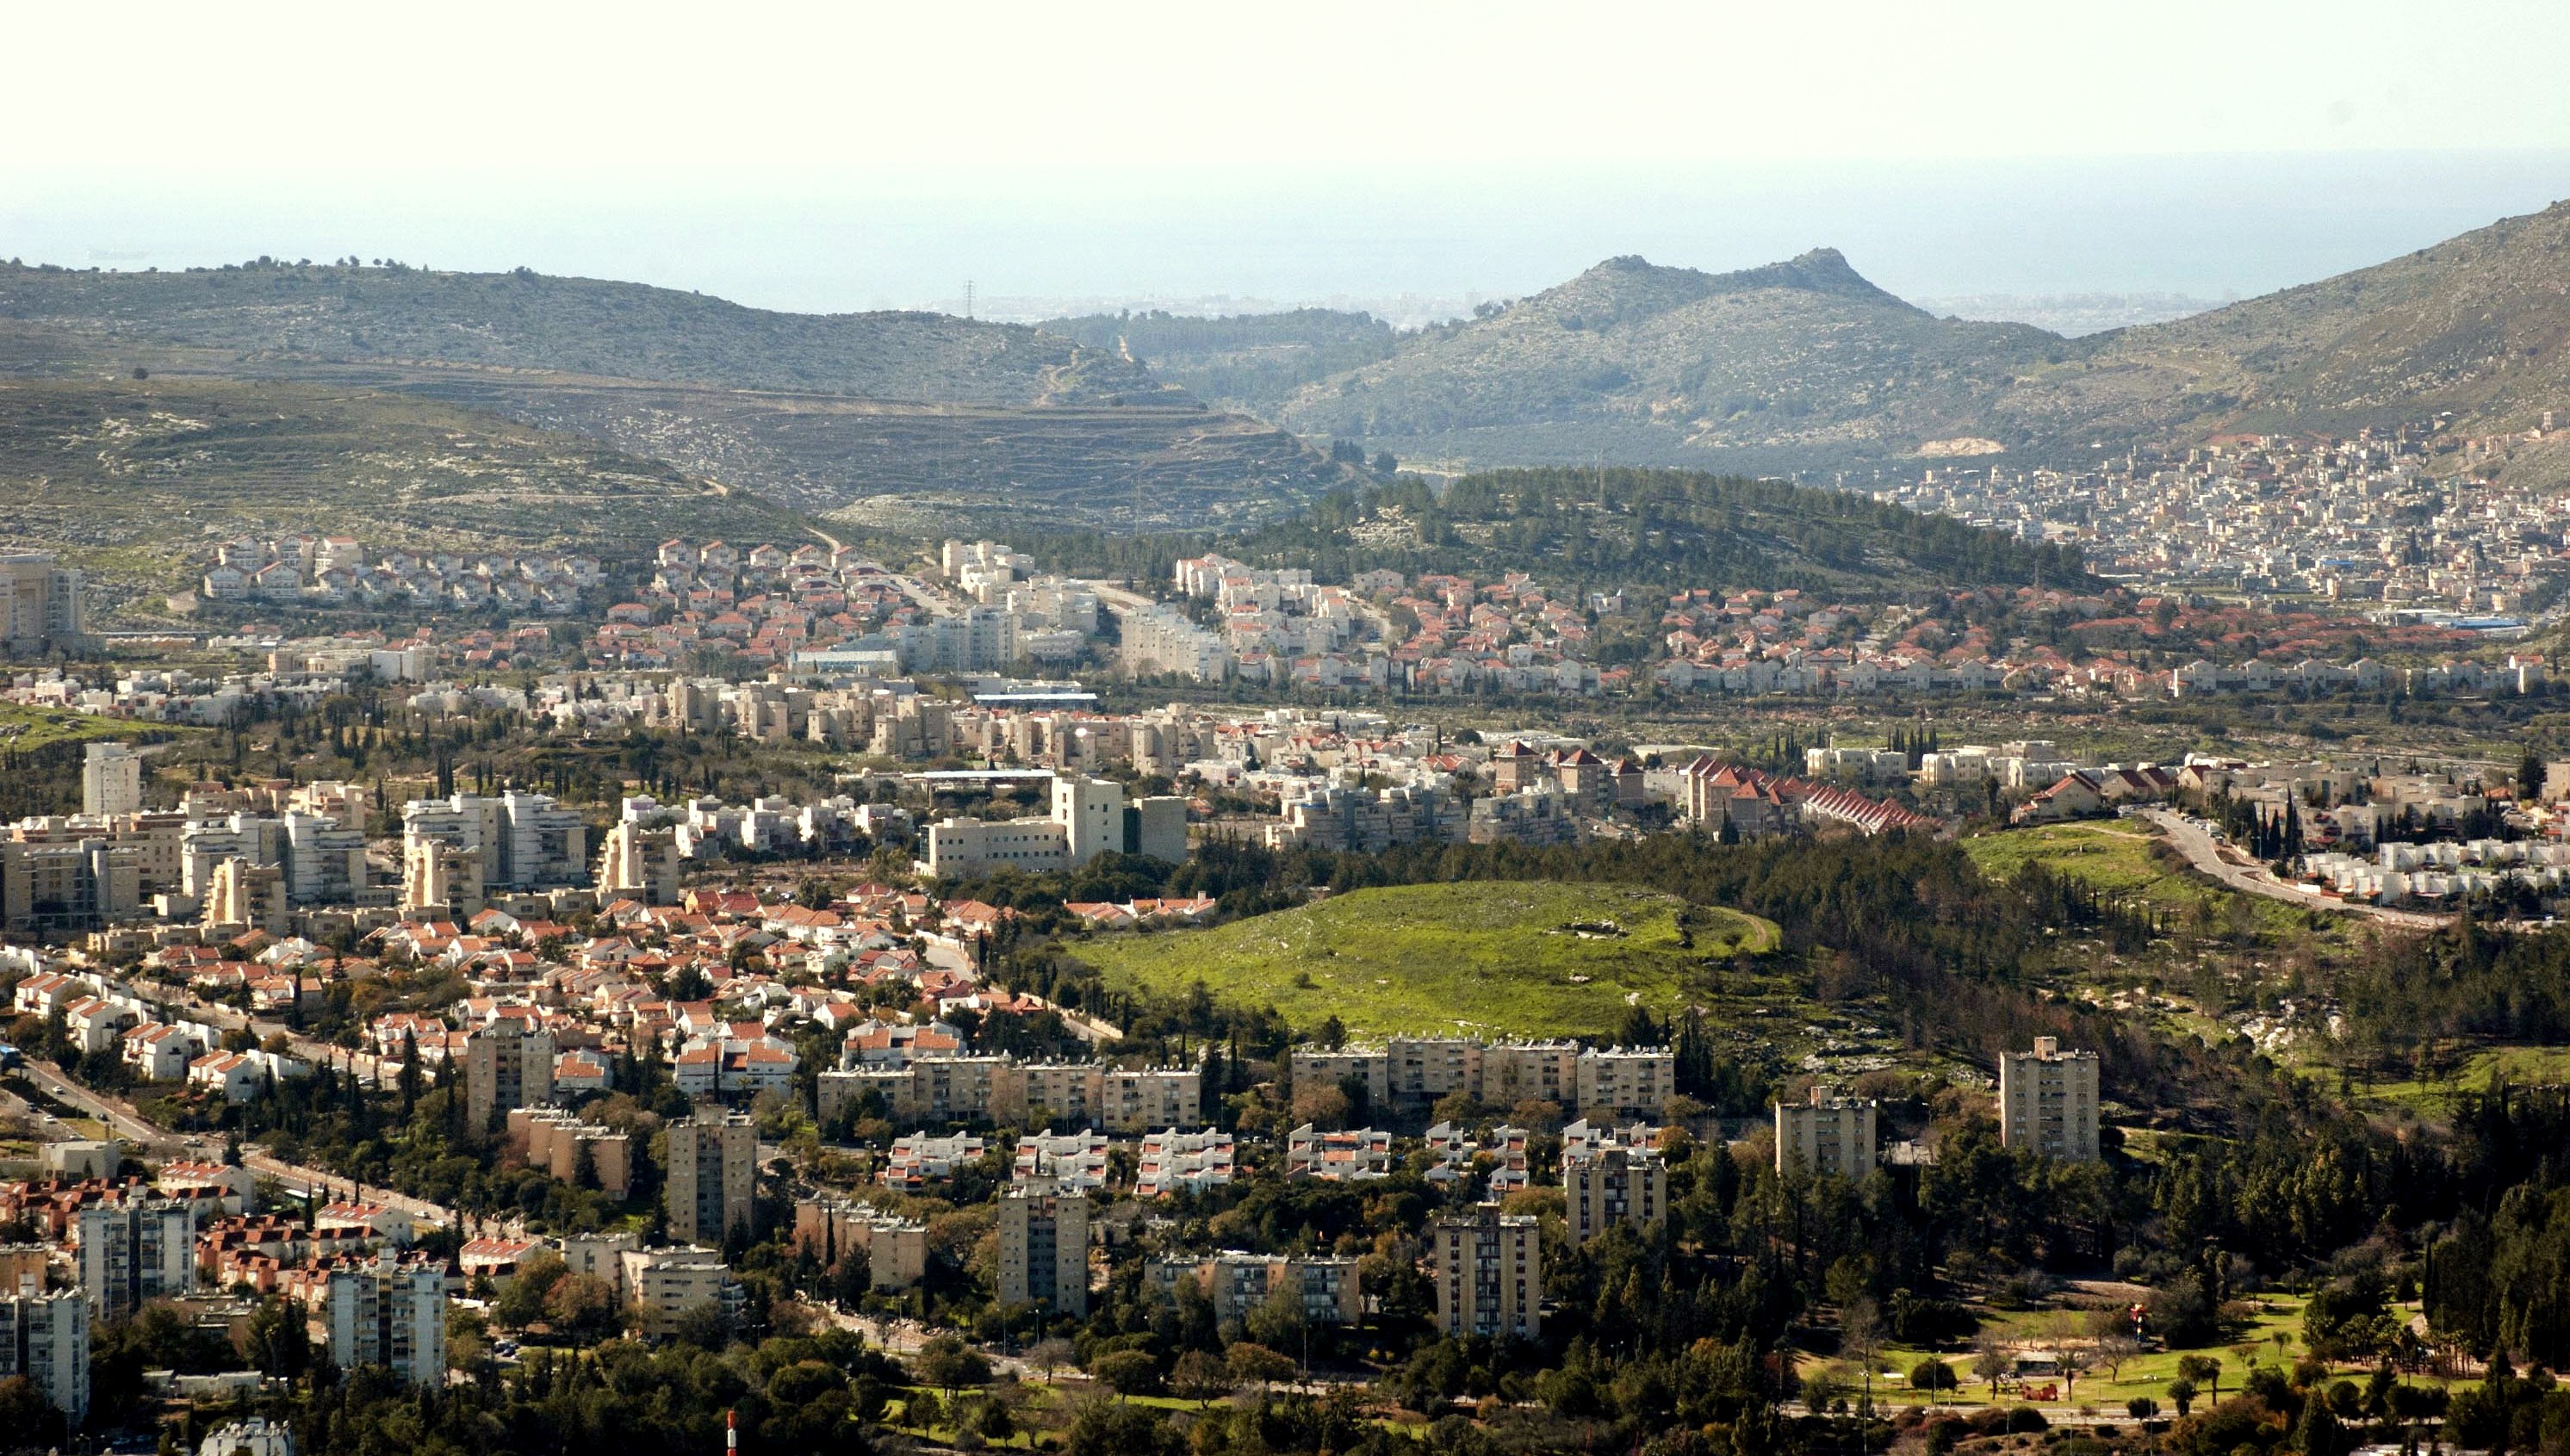
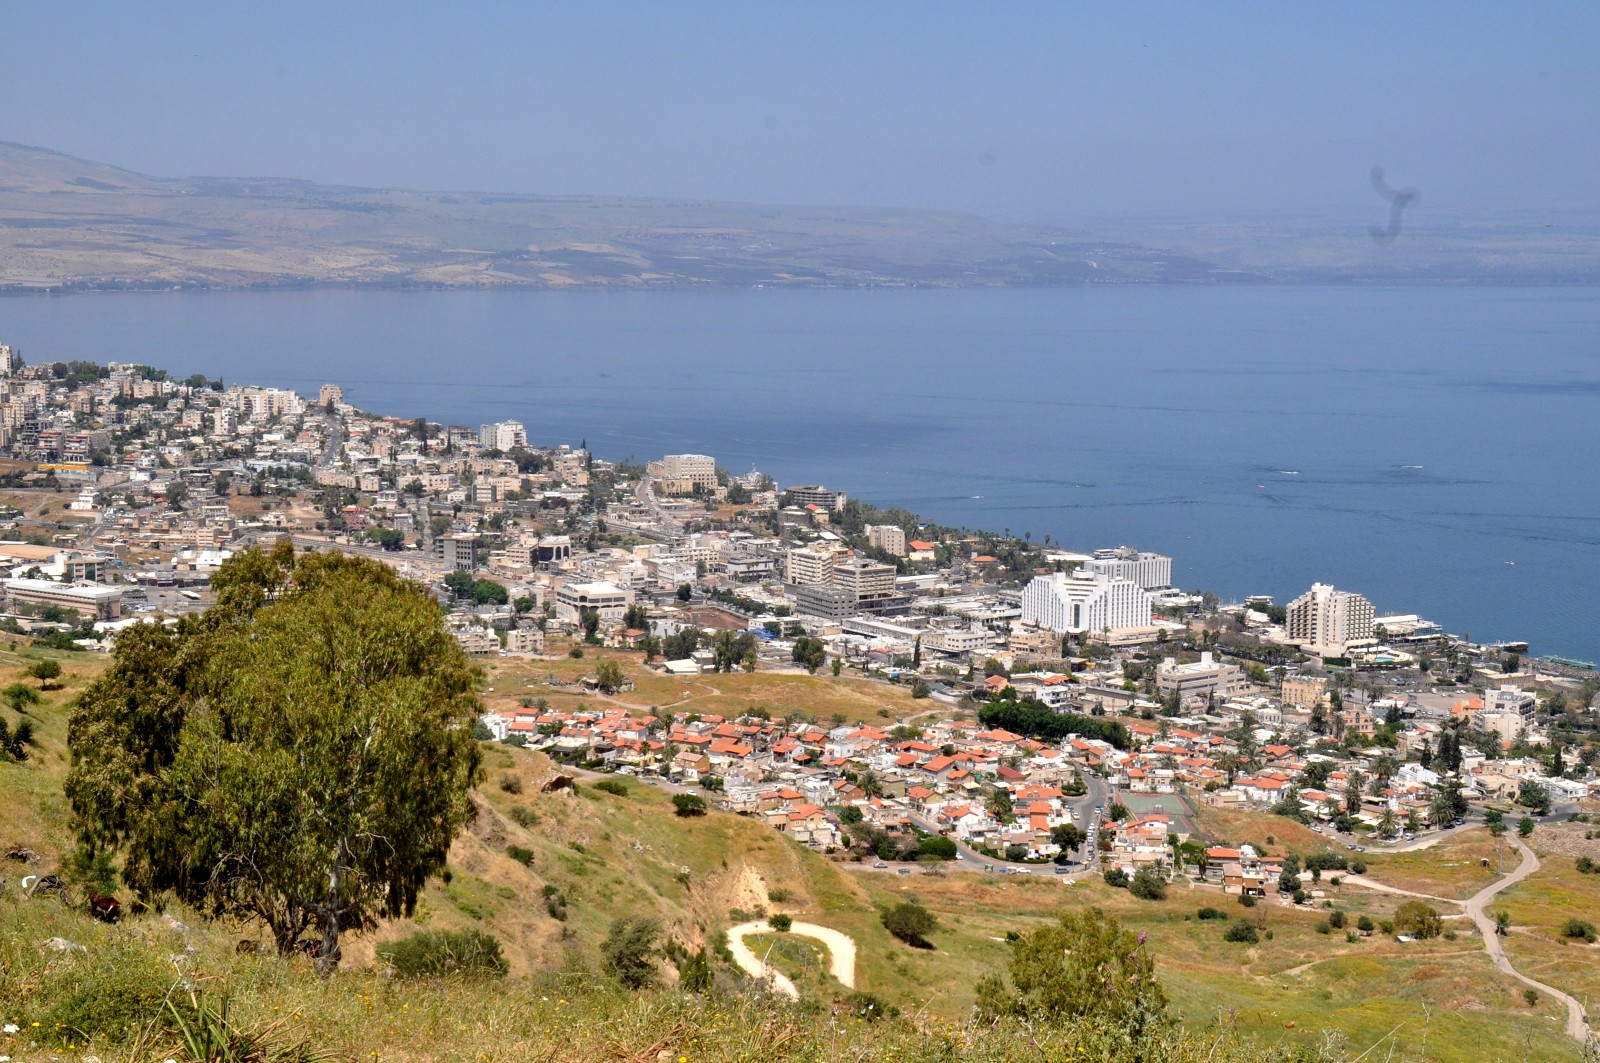
Eilaboun
Eilaboun (عيلبون Ailabun, hebräisch עַילַבּוּן, עֵילַבּוּן) ist ein von israelischen Arabern bewohnter Lokalverband in Israels Nordbezirk. Die rund 4800 Bewohner sind überwiegend christliche Palästinenser.
Eilaboun Wikipedia-Seite

Über unsere Daten
Die Daten auf dieser Seite werden anhand verschiedener öffentlich zugänglicher Werkzeuge und Quellen geschätzt. Sie werden ohne Gewähr bereitgestellt und können Ungenauigkeiten enthalten. Nutzung auf eigene Gefahr.