Kategorien in Govardhan
Branchen
Unternehmensverteilung nach Branche in Govardhan
| Branchenbeschreibung | Anzahl der Betriebe |
|---|---|
| Shopping Sonstige | 98 |
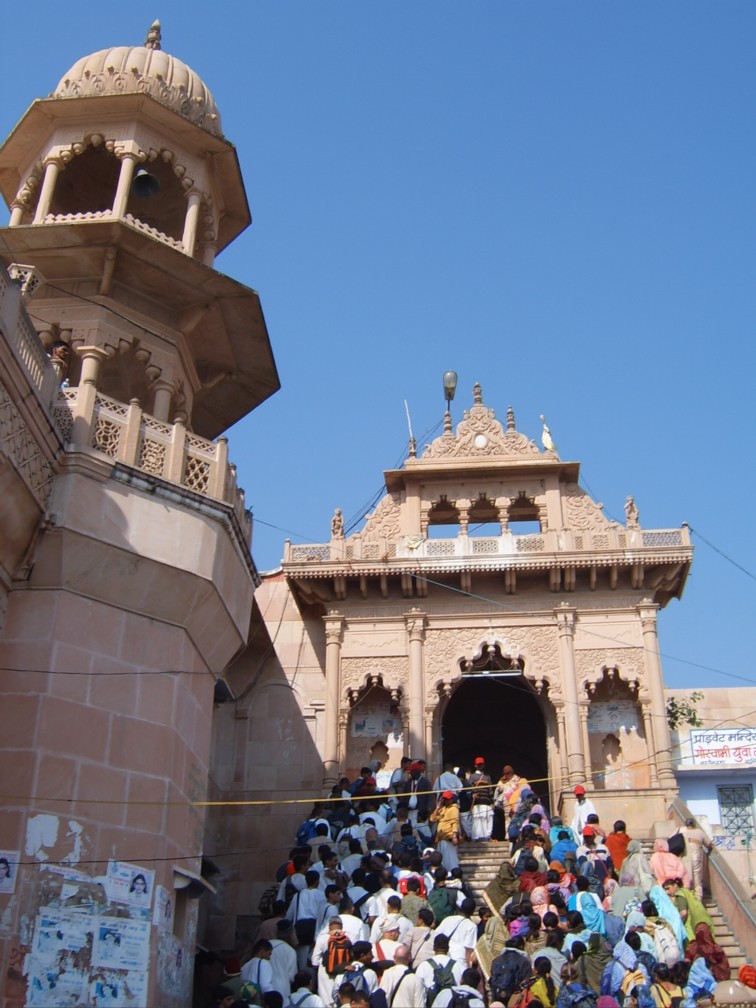
| Hinduistischer Temple | 94 |
| Einkaufen | 93 |
| Religion | 70 |
| Hotels und Motels | 61 |
| Sonstige Beherbergungsstätten | 51 |
| Restaurants | 45 |
| Elektronikläden | 44 |
| Erziehung und Unterricht | 39 |
| Bekleidungsladen | 37 |
Govardhan Facts
| Gebiet | 5.4 km² |
| Bevölkerung | 142.609 |
| Männliche Bevölkerung | 76.502 (53.6%) |
| Weibliche Bevölkerung | 66.107 (46.4%) |
| Population change (1975 to 2020) | -29.0% |
| Population change (2000 to 2020) | +6.2% |
| Mittleres Alter | 20.8 years (Male: 20.4, Female: 21.3) |
| Stadtviertel | Deeg Adda, Thiruvadamathura, Gangapur, hathi darwaza, Bada Bazar |
| Zeit vor Ort | |
| Zeitzone | Indische Normalzeit |
| Geogr. Länge & Breite | 27.49658, 77.46263 |
Karte von Govardhan
Interaktive Karte
Bevölkerung von Govardhan
Jahre 1975 bis 2020
| Data | 1975 | 1990 | 2000 | 2015 | 2020 |
|---|---|---|---|---|---|
| Bevölkerung | 200.733 | 125.690 | 134.272 | 133.916 | 142.609 |
| Bevölkerungsdichte | 36.916,4 / km² | 23.115,4 / km² | 24.693,7 / km² | 24.628,2 / km² | 26.226,9 / km² |
Bevölkerungsänderung in Govardhan von 2000 bis 2015
Rückgang um 0.3 % von 2000 bis 2015
| Standort | Änderung seit 1975 | Änderung seit 1990 | Änderung seit 2000 |
|---|---|---|---|
| Govardhan | -33.3% | +6.5% | -0.3% |
| Uttar Pradesh | +134.1% | +59.5% | +28.4% |
| Indien | +111.1% | +50.6% | +24.5% |
Medianalter von Govardhan
Medianalter: 20.8 Jahre
| Standort | Mittleres Alter | Durchschnittsalter (weiblich) | Durchschnittsalter (männlich) |
|---|---|---|---|
| Govardhan | 20.8 yrs | 21.3 yrs | 20.4 yrs |
| Uttar Pradesh | 21.4 yrs | 21.7 yrs | 21 yrs |
| Indien | 24.9 yrs | 25.4 yrs | 24.5 yrs |
Bevölkerungsdichte von Govardhan
Bevölkerungsdichte: 26.227 / km²
| Standort | Bevölkerung | Gebiet | Dichte |
|---|---|---|---|
| Govardhan | 142.609 | 5,4 km² | 26.227 / km² |
| Uttar Pradesh | 217,8 million | 240.777,3 km² | 905 / km² |
| Indien | 1.307 million | 3.083.563,4 km² | 424 / km² |
Historische und prognostizierte Bevölkerung von Govardhan
Geschätzte Bevölkerung von 0 bis 2100
- JRC (Gemeinsame Forschungsstelle der Europäischen Kommission) arbeitet an GHS built-up grid
- CIESIN (Center for International Earth Science Information Network)
- [Verknüpfung] Klein Goldewijk, K., Beusen, A., Doelman, J., and Stehfest, E.: Anthropogenic land use estimates for the Holocene – HYDE 3.2, Earth Syst. Sci. Data, 9, 927–953, https://doi.org/10.5194/essd-9-927-2017, 2017.
Stadtteile in Govardhan
Prozentsatz der Unternehmen nach Stadtteil in Govardhan
Human Development Index (HDI)
Statistischer zusammengesetzter Index der Lebenserwartung, der Bildung und des Pro-Kopf-Einkommens.
CO2-Emissionen von Govardhan
Kohlendioxid (CO2) -Emissionen pro Kopf in Tonnen pro Jahr
| Standort | CO2-Emissionen | CO2-Emissionen pro Kopf | Intensität der CO2-Emissionen |
|---|---|---|---|
| Govardhan | 199,861 tn | 1.4 tn | 36,756.1 tons/km² |
| Uttar Pradesh | 259,048,938 tn | 1.19 tn | 1,075.9 tons/km² |
| Indien | 1,928,568,344 tn | 1.48 tn | 625.4 tons/km² |
| CO2-Emissionen 2013 (Tonnen/Jahr) | 199,861 tn |
| CO2-Emissionen 2013 (Tonnen/Jahr) pro Kopf | 1.4 tn |
| CO2-Emissionsintensität 2013 (Tonnen/km²/Jahr) | 36,756.1 tons/km² |
Naturgefahrenrisiko
Relatives Risiko von 10
| Gefahr | Risikostufe |
|---|---|
| Dürre | Hoch (9) |
| Flut | Hoch (10) |
| Erdbeben | Mittel (4) |
* Das Risiko, insbesondere in Bezug auf Überschwemmungen oder Erdrutsche, gilt möglicherweise nicht für das gesamte Gebiet.
- Dilley, M., R.S. Chen, U. Deichmann, A.L. Lerner-Lam, M. Arnold, J. Agwe, P. Buys, O. Kjekstad, B. Lyon, and G. Yetman. 2005. Natural Disaster Hotspots: A Global Risk Analysis. Washington, D.C.: World Bank. https://doi.org/10.1596/0-8213-5930-4.
- Center for Hazards and Risk Research - CHRR - Columbia University, Center for International Earth Science Information Network - CIESIN - Columbia University, and International Research Institute for Climate and Society - IRI - Columbia University. 2005. Global Drought Hazard Frequency and Distribution. Palisades, NY: NASA Socioeconomic Data and Applications Center (SEDAC). https://doi.org/10.7927/H4VX0DFT.
- Center for Hazards and Risk Research - CHRR - Columbia University, Center for International Earth Science Information Network - CIESIN - Columbia University. 2005. Global Flood Hazard Frequency and Distribution. Palisades, NY: NASA Socioeconomic Data and Applications Center (SEDAC). https://doi.org/10.7927/H4668B3D.
- Center for Hazards and Risk Research - CHRR - Columbia University, Center for International Earth Science Information Network - CIESIN - Columbia University. 2005. Global Earthquake Hazard Distribution - Peak Ground Acceleration. Palisades, NY: NASA Socioeconomic Data and Applications Center (SEDAC). https://doi.org/10.7927/H4BZ63ZS.
Aktuelle Erdbeben in der Nähe
Magnitude 3.0 und höher
| Datum▼ | Zeit↕ | Magnitude↕ | Distance↕ | Tiefe↕ | Standort↕ | Verknüpfung |
|---|---|---|---|---|---|---|
| 3/16/19 | 11:41 PM | 4 | 58.9 km | 10,000 m | 11km W of Govindgarh, India | usgs.gov |
| 11/16/16 | 10:59 PM | 4.4 | 93.6 km | 10,000 m | 14km SE of Bawal, India | usgs.gov |
| 10/18/07 | 5:54 AM | 4.7 | 36.2 km | 10,000 m | Rajasthan-Uttar Pradesh border region, India | usgs.gov |
| 11/29/06 | 5:41 AM | 4 | 64.7 km | 10,000 m | Rajasthan, India | usgs.gov |
Über unsere Daten
Die Daten auf dieser Seite werden anhand verschiedener öffentlich zugänglicher Werkzeuge und Quellen geschätzt. Sie werden ohne Gewähr bereitgestellt und können Ungenauigkeiten enthalten. Nutzung auf eigene Gefahr.