Kategorien in Masuri
Branchen
Unternehmensverteilung nach Branche in Masuri
| Branchenbeschreibung | Anzahl der Betriebe | Durchschnittsalter des Geschäfts |
|---|---|---|
| Hotels und Motels | 511 | — |
| Sonstige Beherbergungsstätten | 340 | — |
| Restaurants | 285 | — |
| Einkaufen | 156 | — |
| Bekleidungsladen | 93 | — |
| Shopping Sonstige | 60 | — |
| Cafés | 59 | — |
| Erziehung und Unterricht | 58 | 134 years |
| Taxen | 55 | — |
Masuri Facts
| Gebiet | 14.3 km² |
| Bevölkerung | 9.316 |
| Männliche Bevölkerung | 4.902 (52.6%) |
| Weibliche Bevölkerung | 4.414 (47.4%) |
| Population change (1975 to 2020) | +1344.3% |
| Population change (2000 to 2020) | +280.7% |
| Mittleres Alter | 26 years (Male: 25.6, Female: 26.4) |
| BIP pro Kopf (KKP) | $8.775 (2022) |
| Stadtviertel | The Mall Road, Landour, Luxmanpuri, Rajmandi, Landour, Charleville, Survey Colony |
| Zeit vor Ort | |
| Zeitzone | Indische Normalzeit |
| Geogr. Länge & Breite | 30.45498, 78.07068 |
| Postleitzahlen | 247981, 248079, 248122, 248749 |
Karte von Masuri
Interaktive Karte
Bevölkerung von Masuri
Jahre 1975 bis 2030
| Data | 1975 | 1990 | 2000 | 2015 | 2020 | 2025* | 2030* |
|---|---|---|---|---|---|---|---|
| Bevölkerung | 645 | 1.275 | 2.447 | 5.428 | 9.316 | 10.144 | 10.957 |
| Bevölkerungsdichte | 45,3 / km² | 89,5 / km² | 171,7 / km² | 380,9 / km² | 653,8 / km² | 711,9 / km² | 768,9 / km² |
Bevölkerungsänderung in Masuri von 2000 bis 2020
Anstieg um 280.7 % von 2000 bis 2020
| Standort | Änderung seit 1975 | Änderung seit 1990 | Änderung seit 2000 |
|---|---|---|---|
| Masuri | +1344.3% | +630.7% | +280.7% |
| Uttarakhand | — | — | — |
| Indien | — | — | — |
Medianalter von Masuri
Medianalter: 26 Jahre
| Standort | Mittleres Alter | Durchschnittsalter (weiblich) | Durchschnittsalter (männlich) |
|---|---|---|---|
| Masuri | 26 yrs | 26.4 yrs | 25.6 yrs |
| Uttarakhand | 24 yrs | 24.7 yrs | 23.3 yrs |
| Indien | 24.9 yrs | 25.4 yrs | 24.5 yrs |
Bevölkerungsdichte von Masuri
Bevölkerungsdichte: 654 / km²
| Standort | Bevölkerung | Gebiet | Dichte |
|---|---|---|---|
| Masuri | 9.316 | 14,3 km² | 654 / km² |
| Uttarakhand | 11,1 million | 53.694,7 km² | 207 / km² |
| Indien | 1.307 million | 3.083.563,4 km² | 424 / km² |
Historische und prognostizierte Bevölkerung von Masuri
Geschätzte Bevölkerung von 1700 bis 2100
- JRC (Gemeinsame Forschungsstelle der Europäischen Kommission) arbeitet an GHS built-up grid
- CIESIN (Center for International Earth Science Information Network)
- [Verknüpfung] Klein Goldewijk, K., Beusen, A., Doelman, J., and Stehfest, E.: Anthropogenic land use estimates for the Holocene – HYDE 3.2, Earth Syst. Sci. Data, 9, 927–953, https://doi.org/10.5194/essd-9-927-2017, 2017.
Stadtteile in Masuri
Prozentsatz der Unternehmen nach Stadtteil in Masuri
Price Distribution
Geschäftsverteilung nach Preis für Masuri
Human Development Index (HDI)
Statistischer zusammengesetzter Index der Lebenserwartung, der Bildung und des Pro-Kopf-Einkommens.
Bruttoinlandsprodukt (BIP) von Masuri
BIP pro Kopf, KKP (konstante internationale $ von 2017)
| Data | 1990 | 1995 | 2000 | 2005 | 2010 | 2015 | 2020 | 2022 |
|---|---|---|---|---|---|---|---|---|
| BIP pro Kopf | $2.879 | $2.027 | $2.474 | $3.523 | $5.291 | $6.518 | $8.088 | $8.775 |
| BIP insgesamt | $30,4 Mio. | $21,7 Mio. | $26,9 Mio. | $39,5 Mio. | $61 Mio. | $77,8 Mio. | $104,1 Mio. | $115,7 Mio. |
CO2-Emissionen von Masuri
Kohlendioxid (CO2) -Emissionen pro Kopf in Tonnen pro Jahr
| Standort | CO2-Emissionen | CO2-Emissionen pro Kopf | Intensität der CO2-Emissionen |
|---|---|---|---|
| Masuri | 22,009 tn | 2.36 tn | 1,544.5 tons/km² |
| Uttarakhand | 18,382,127 tn | 1.66 tn | 342.3 tons/km² |
| Indien | 1,928,568,344 tn | 1.48 tn | 625.4 tons/km² |
| CO2-Emissionen 2013 (Tonnen/Jahr) | 22,009 tn |
| CO2-Emissionen 2013 (Tonnen/Jahr) pro Kopf | 2.36 tn |
| CO2-Emissionsintensität 2013 (Tonnen/km²/Jahr) | 1,544.5 tons/km² |
Naturgefahrenrisiko
Relatives Risiko von 10
| Gefahr | Risikostufe |
|---|---|
| Dürre | Hoch (8) |
| Flut | Hoch (8) |
| Erdbeben | Hoch (8) |
| Erdrutsch | Hoch (8) |
* Das Risiko, insbesondere in Bezug auf Überschwemmungen oder Erdrutsche, gilt möglicherweise nicht für das gesamte Gebiet.
- Dilley, M., R.S. Chen, U. Deichmann, A.L. Lerner-Lam, M. Arnold, J. Agwe, P. Buys, O. Kjekstad, B. Lyon, and G. Yetman. 2005. Natural Disaster Hotspots: A Global Risk Analysis. Washington, D.C.: World Bank. https://doi.org/10.1596/0-8213-5930-4.
- Center for Hazards and Risk Research - CHRR - Columbia University, Center for International Earth Science Information Network - CIESIN - Columbia University, and Norwegian Geotechnical Institute - NGI. 2005. Global Landslide Hazard Distribution. Palisades, NY: NASA Socioeconomic Data and Applications Center (SEDAC). https://doi.org/10.7927/H4P848VZ.
- Center for Hazards and Risk Research - CHRR - Columbia University, Center for International Earth Science Information Network - CIESIN - Columbia University, and International Research Institute for Climate and Society - IRI - Columbia University. 2005. Global Drought Hazard Frequency and Distribution. Palisades, NY: NASA Socioeconomic Data and Applications Center (SEDAC). https://doi.org/10.7927/H4VX0DFT.
- Center for Hazards and Risk Research - CHRR - Columbia University, Center for International Earth Science Information Network - CIESIN - Columbia University. 2005. Global Flood Hazard Frequency and Distribution. Palisades, NY: NASA Socioeconomic Data and Applications Center (SEDAC). https://doi.org/10.7927/H4668B3D.
- Center for Hazards and Risk Research - CHRR - Columbia University, Center for International Earth Science Information Network - CIESIN - Columbia University. 2005. Global Earthquake Hazard Distribution - Peak Ground Acceleration. Palisades, NY: NASA Socioeconomic Data and Applications Center (SEDAC). https://doi.org/10.7927/H4BZ63ZS.
Aktuelle Erdbeben in der Nähe
Magnitude 3.0 und höher
| Datum▼ | Zeit↕ | Magnitude↕ | Distance↕ | Tiefe↕ | Standort↕ | Verknüpfung |
|---|---|---|---|---|---|---|
| 6/14/18 | 12:42 AM | 4.4 | 49.4 km | 10,000 m | 9km ENE of Barkot, India | usgs.gov |
| 6/6/18 | 5:41 PM | 4.5 | 88.2 km | 10,000 m | 45km E of Uttarkashi, India | usgs.gov |
| 8/27/16 | 3:38 AM | 4.1 | 88.7 km | 10,000 m | 2km E of Rohru, India | usgs.gov |
| 2/11/13 | 10:48 AM | 4.6 | 60 km | 10,000 m | 21km NNE of Barkot, India | usgs.gov |
| 11/27/12 | 12:15 PM | 4.4 | 59.7 km | 23,400 m | Uttaranchal, India | usgs.gov |
| 2/9/12 | 7:17 PM | 5.1 | 62.3 km | 6,200 m | Uttaranchal, India | usgs.gov |
| 5/28/10 | 7:25 AM | 5 | 78.6 km | 18,800 m | Himachal Pradesh, India | usgs.gov |
| 5/3/10 | 5:15 PM | 4 | 31.1 km | 13,500 m | Uttaranchal, India | usgs.gov |
| 8/16/08 | 7:16 PM | 3.8 | 37.5 km | 10,000 m | Haryana - Uttaranchal region, India | usgs.gov |
| 8/7/07 | 10:11 AM | 3.8 | 57.3 km | 10,000 m | Uttaranchal, India | usgs.gov |
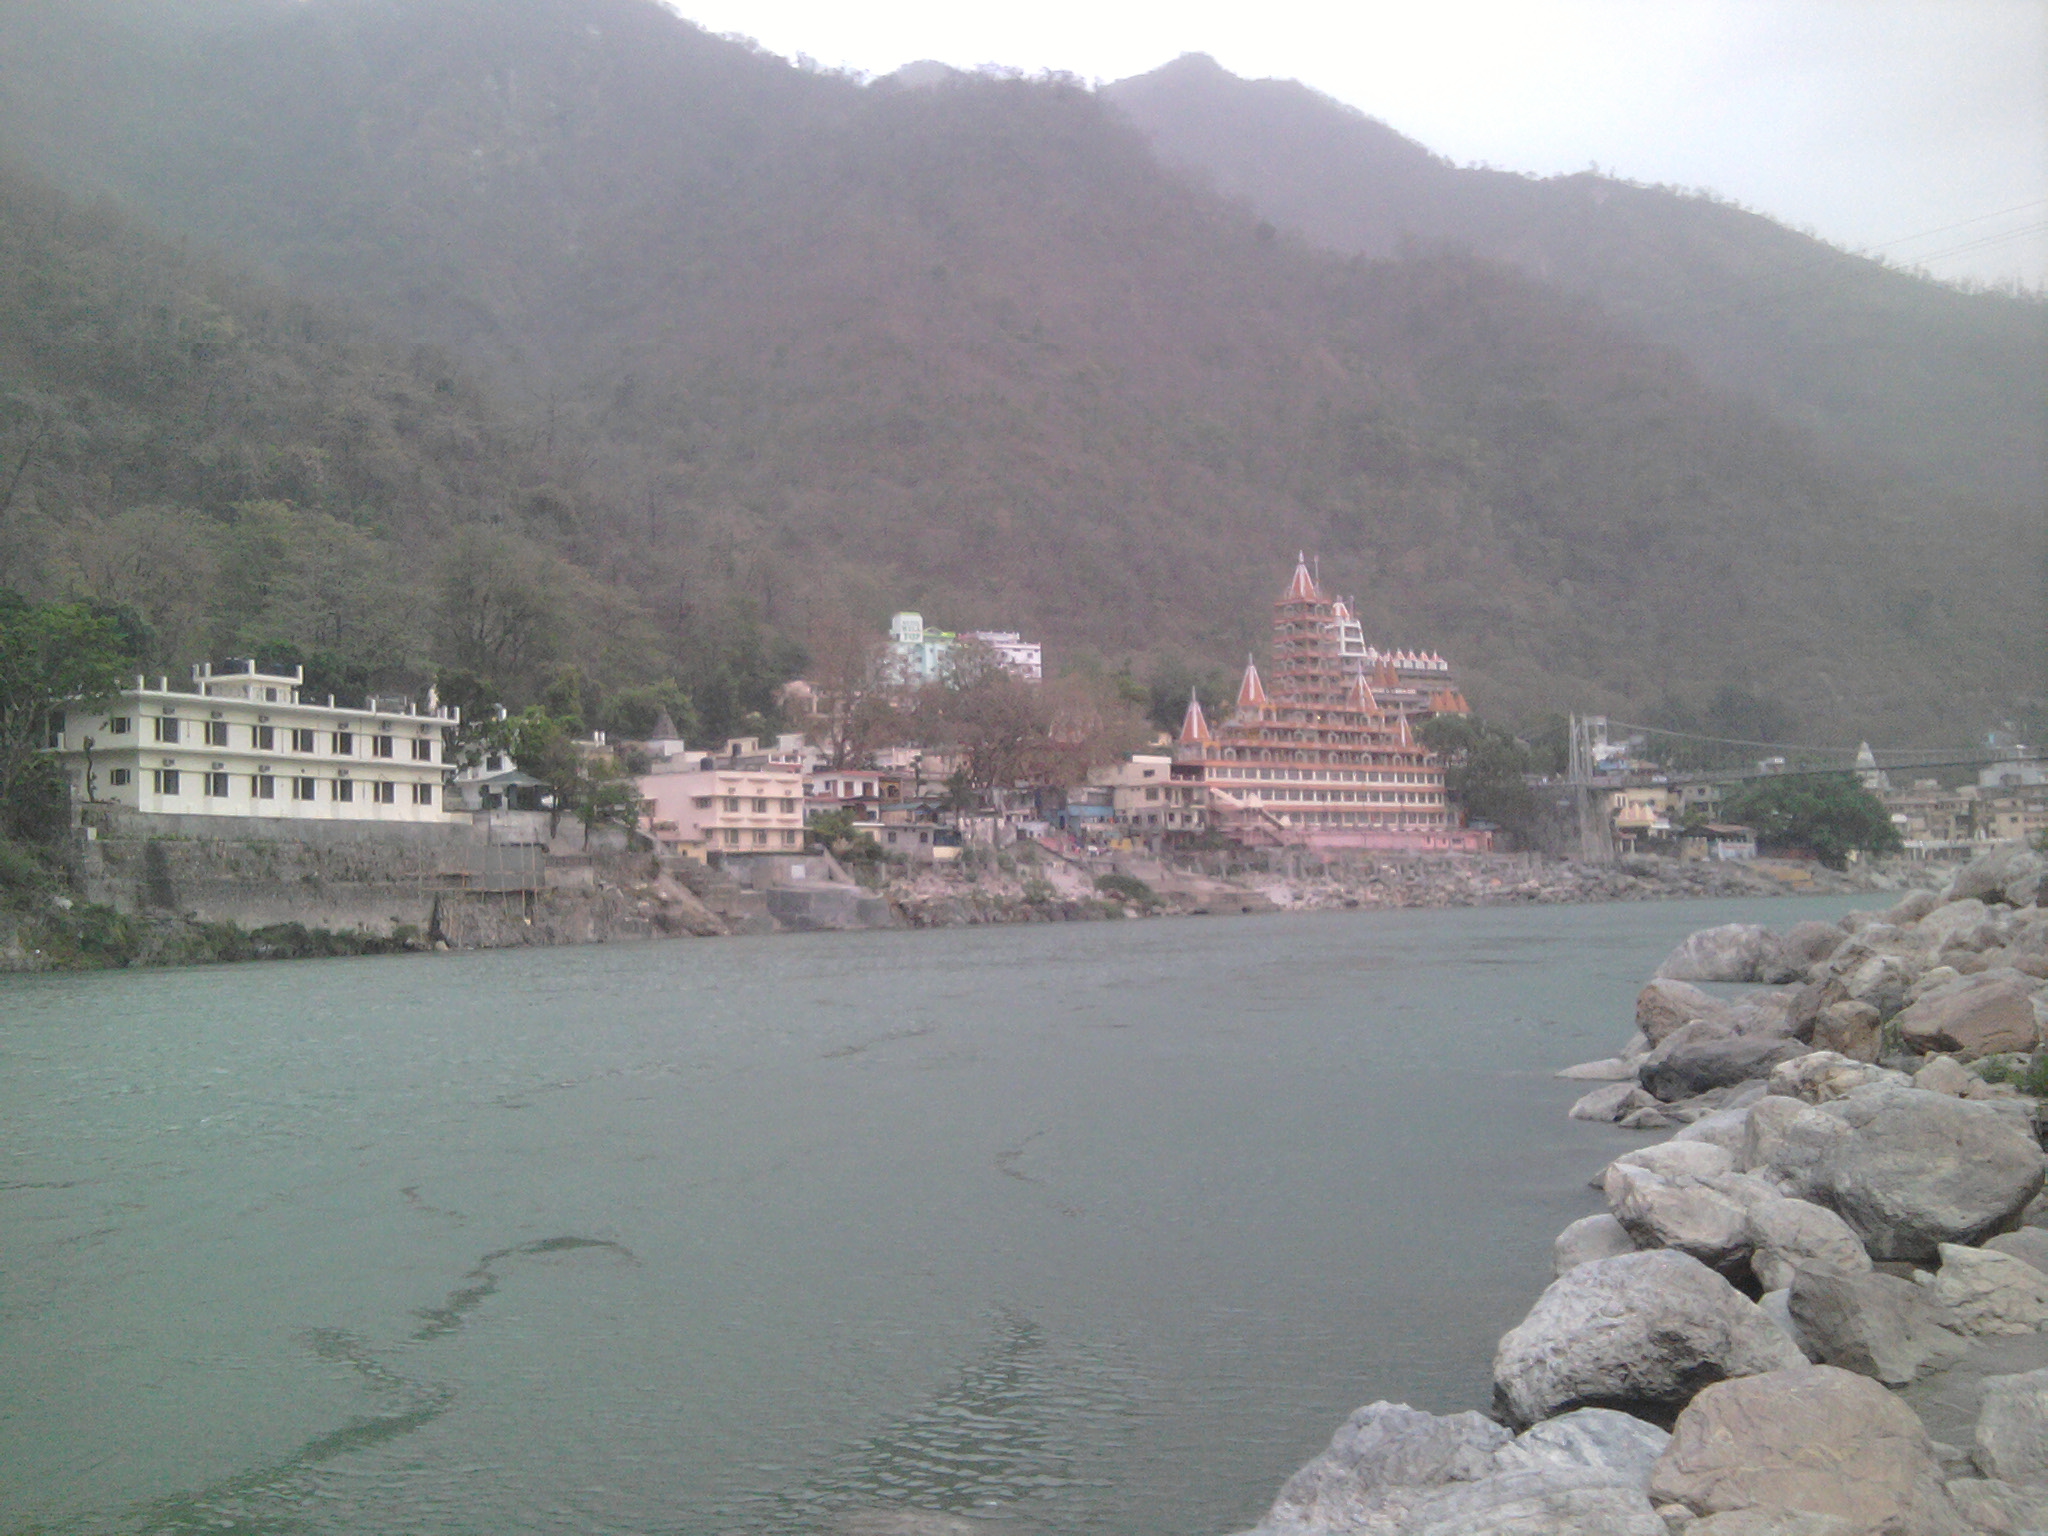
Masuri
(Hindi: मसूरी, Masūrī; Englisch: Mussoorie) ist eine kleine Stadt mit 26.075 (2001) Einwohnern im indischen Bundesstaat Uttarakhand. Es liegt 278 km nördlich von Delhi und 34 km von Dehradun, der Hauptstadt des Bundesstaates, entfernt auf einer Höhe von etwa..
Masuri Wikipedia-Seite


Über unsere Daten
Die Daten auf dieser Seite werden anhand verschiedener öffentlich zugänglicher Werkzeuge und Quellen geschätzt. Sie werden ohne Gewähr bereitgestellt und können Ungenauigkeiten enthalten. Nutzung auf eigene Gefahr.