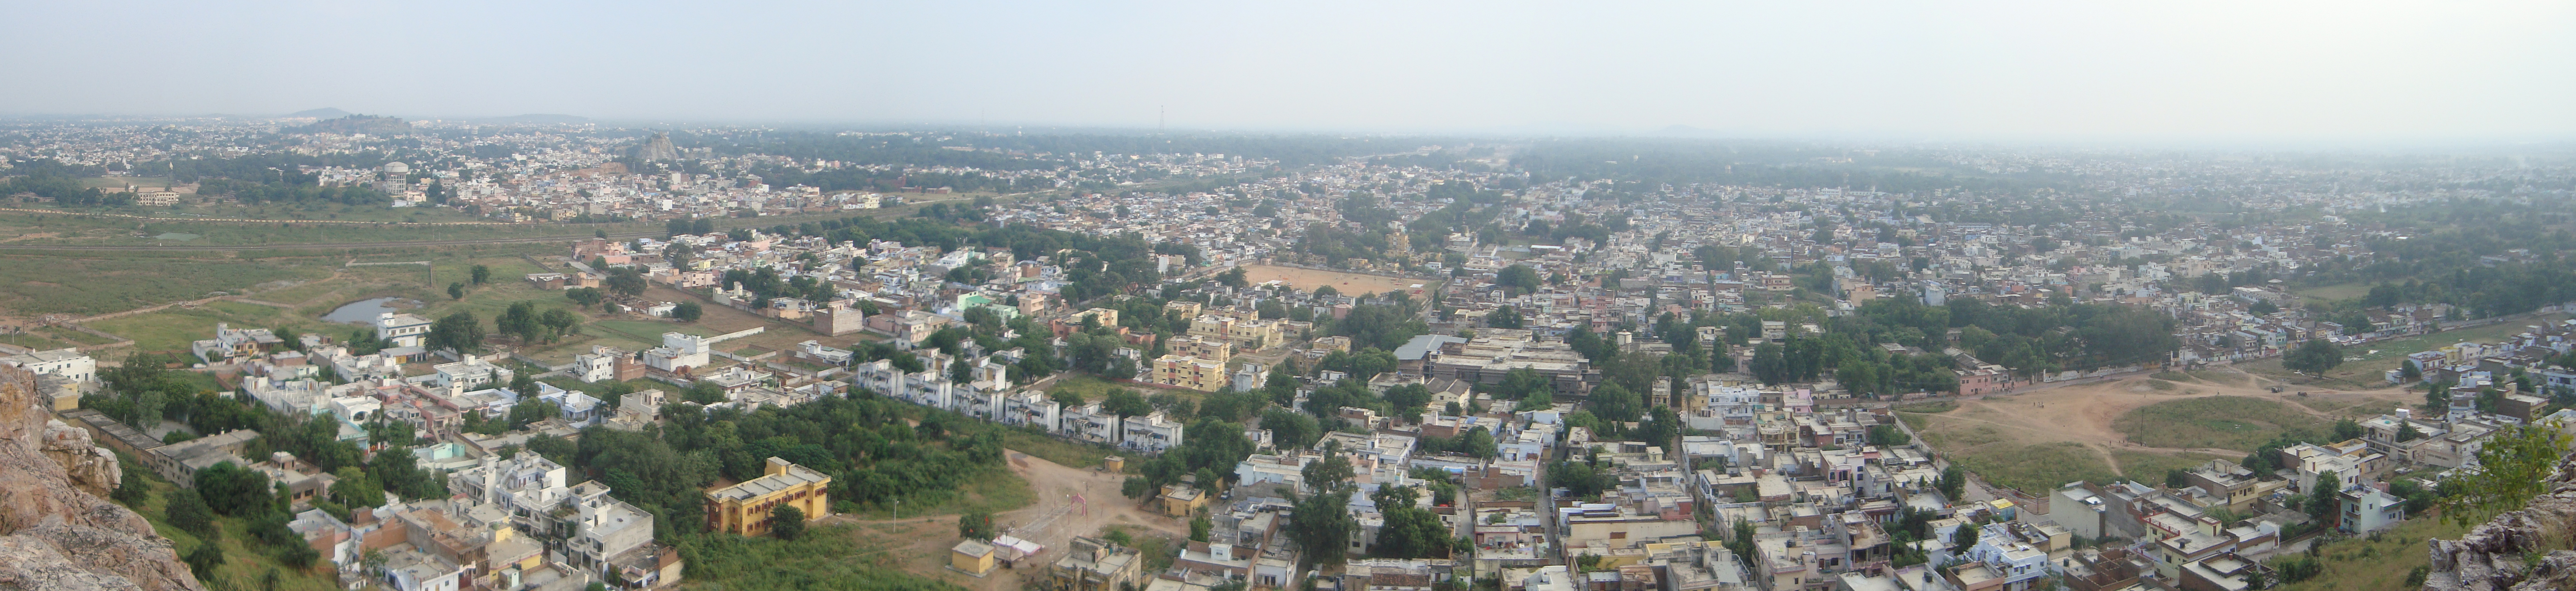
Kategorien in Shivpuri
Shivpuri Facts
| Gebiet | 17.7 km² |
| Bevölkerung | 223.172 |
| Männliche Bevölkerung | 114.529 (51.3%) |
| Weibliche Bevölkerung | 108.643 (48.7%) |
| Population change (1975 to 2020) | +95.2% |
| Population change (2000 to 2020) | +28.2% |
| Mittleres Alter | 23.4 years (Male: 22.5, Female: 24.3) |
| Zeit vor Ort | |
| Zeitzone | Indische Normalzeit |
| Geogr. Länge & Breite | 25.42378, 77.66223 |
Karte von Shivpuri
Interaktive Karte
Bevölkerung von Shivpuri
Jahre 1975 bis 2020
| Data | 1975 | 1990 | 2000 | 2015 | 2020 |
|---|---|---|---|---|---|
| Bevölkerung | 114.325 | 160.608 | 174.111 | 215.873 | 223.172 |
| Bevölkerungsdichte | 6.463,6 / km² | 9.080,3 / km² | 9.843,7 / km² | 12.204,8 / km² | 12.617,5 / km² |
Quellen: JRC (Gemeinsame Forschungsstelle der Europäischen Kommission) arbeitet an GHS built-up grid
Bevölkerungsänderung in Shivpuri von 2000 bis 2015
Anstieg um 24 % von 2000 bis 2015
| Standort | Änderung seit 1975 | Änderung seit 1990 | Änderung seit 2000 |
|---|---|---|---|
| Shivpuri | +88.8% | +34.4% | +24% |
| Madhya Pradesh | +134% | +59.7% | +28.6% |
| Indien | +111.1% | +50.6% | +24.5% |
Quellen: JRC (Gemeinsame Forschungsstelle der Europäischen Kommission) arbeitet an GHS built-up grid
Medianalter von Shivpuri
Medianalter: 23.4 Jahre
| Standort | Mittleres Alter | Durchschnittsalter (weiblich) | Durchschnittsalter (männlich) |
|---|---|---|---|
| Shivpuri | 23.4 yrs | 24.3 yrs | 22.5 yrs |
| Madhya Pradesh | 23.4 yrs | 23.7 yrs | 23.1 yrs |
| Indien | 24.9 yrs | 25.4 yrs | 24.5 yrs |
Quellen: CIESIN (Center for International Earth Science Information Network)
Bevölkerungsdichte von Shivpuri
Bevölkerungsdichte: 12.618 / km²
| Standort | Bevölkerung | Gebiet | Dichte |
|---|---|---|---|
| Shivpuri | 223.172 | 17,7 km² | 12.618 / km² |
| Madhya Pradesh | 79,1 million | 308.149,6 km² | 257 / km² |
| Indien | 1.307 million | 3.083.563,4 km² | 424 / km² |
Quellen: JRC (Gemeinsame Forschungsstelle der Europäischen Kommission) arbeitet an GHS built-up grid
Historische und prognostizierte Bevölkerung von Shivpuri
Geschätzte Bevölkerung von 0 bis 2100
Quellen:
- JRC (Gemeinsame Forschungsstelle der Europäischen Kommission) arbeitet an GHS built-up grid
- CIESIN (Center for International Earth Science Information Network)
- [Verknüpfung] Klein Goldewijk, K., Beusen, A., Doelman, J., and Stehfest, E.: Anthropogenic land use estimates for the Holocene – HYDE 3.2, Earth Syst. Sci. Data, 9, 927–953, https://doi.org/10.5194/essd-9-927-2017, 2017.
Human Development Index (HDI)
Statistischer zusammengesetzter Index der Lebenserwartung, der Bildung und des Pro-Kopf-Einkommens.
Quelle: [Verknüpfung] Kummu, M., Taka, M. &Guillaume, J. Gridded global datasets for Gross Domestic Product and Human Development Index over 1990–2015. Sci Data 5, 180004 (2018) doi:10.1038/sdata.2018.4
CO2-Emissionen von Shivpuri
Kohlendioxid (CO2) -Emissionen pro Kopf in Tonnen pro Jahr
| Standort | CO2-Emissionen | CO2-Emissionen pro Kopf | Intensität der CO2-Emissionen |
|---|---|---|---|
| Shivpuri | 328,074 tn | 1.47 tn | 18,548.4 tons/km² |
| Madhya Pradesh | 98,758,435 tn | 1.25 tn | 320.5 tons/km² |
| Indien | 1,928,568,344 tn | 1.48 tn | 625.4 tons/km² |
Quellen: [Verknüpfung] Moran, D., Kanemoto K; Jiborn, M., Wood, R., Többen, J., and Seto, K.C. (2018) CO2-Fußabdruck von 13.000 Städten. Environmental Research Letters DOI: 10.1088/1748-9326/aac72a
CO2-Emissionen von Shivpuri
| CO2-Emissionen 2013 (Tonnen/Jahr) | 328,074 tn |
| CO2-Emissionen 2013 (Tonnen/Jahr) pro Kopf | 1.47 tn |
| CO2-Emissionsintensität 2013 (Tonnen/km²/Jahr) | 18,548.4 tons/km² |
Naturgefahrenrisiko
Relatives Risiko von 10
| Gefahr | Risikostufe |
|---|---|
| Dürre | Hoch (7.3) |
| Flut | Hoch (8) |
| Erdbeben | Mittel (5.7) |
| Erdrutsch | Mittel (7) |
* Das Risiko, insbesondere in Bezug auf Überschwemmungen oder Erdrutsche, gilt möglicherweise nicht für das gesamte Gebiet.
Quellen:
- Dilley, M., R.S. Chen, U. Deichmann, A.L. Lerner-Lam, M. Arnold, J. Agwe, P. Buys, O. Kjekstad, B. Lyon, and G. Yetman. 2005. Natural Disaster Hotspots: A Global Risk Analysis. Washington, D.C.: World Bank. https://doi.org/10.1596/0-8213-5930-4.
- Center for Hazards and Risk Research - CHRR - Columbia University, Center for International Earth Science Information Network - CIESIN - Columbia University, and Norwegian Geotechnical Institute - NGI. 2005. Global Landslide Hazard Distribution. Palisades, NY: NASA Socioeconomic Data and Applications Center (SEDAC). https://doi.org/10.7927/H4P848VZ.
- Center for Hazards and Risk Research - CHRR - Columbia University, Center for International Earth Science Information Network - CIESIN - Columbia University, and International Research Institute for Climate and Society - IRI - Columbia University. 2005. Global Drought Hazard Frequency and Distribution. Palisades, NY: NASA Socioeconomic Data and Applications Center (SEDAC). https://doi.org/10.7927/H4VX0DFT.
- Center for Hazards and Risk Research - CHRR - Columbia University, Center for International Earth Science Information Network - CIESIN - Columbia University. 2005. Global Flood Hazard Frequency and Distribution. Palisades, NY: NASA Socioeconomic Data and Applications Center (SEDAC). https://doi.org/10.7927/H4668B3D.
- Center for Hazards and Risk Research - CHRR - Columbia University, Center for International Earth Science Information Network - CIESIN - Columbia University. 2005. Global Earthquake Hazard Distribution - Peak Ground Acceleration. Palisades, NY: NASA Socioeconomic Data and Applications Center (SEDAC). https://doi.org/10.7927/H4BZ63ZS.

Über unsere Daten
Die Daten auf dieser Seite werden anhand verschiedener öffentlich zugänglicher Werkzeuge und Quellen geschätzt. Sie werden ohne Gewähr bereitgestellt und können Ungenauigkeiten enthalten. Nutzung auf eigene Gefahr.