Branchen
Unternehmensverteilung nach Branche in Barbianello
| Branchenbeschreibung | Anzahl der Betriebe |
|---|---|
| Hochbau | 5 |
Barbianello Facts
| Gebiet | 0.4 km² |
| Bevölkerung | 534 |
| Männliche Bevölkerung | 274 (51.3%) |
| Weibliche Bevölkerung | 260 (48.7%) |
| Population change (1975 to 2020) | +25.1% |
| Population change (2000 to 2020) | +9.7% |
| Mittleres Alter | 41.9 years (Male: 41.7, Female: 42.3) |
| Zeit vor Ort | |
| Zeitzone | Mitteleuropäische Sommerzeit |
| Geogr. Länge & Breite | 45.07571, 9.20602 |
Karte von Barbianello
Interaktive Karte
Bevölkerung von Barbianello
Jahre 1975 bis 2020
| Data | 1975 | 1990 | 2000 | 2015 | 2020 |
|---|---|---|---|---|---|
| Bevölkerung | 427 | 462 | 487 | 537 | 534 |
| Bevölkerungsdichte | 1.138,7 / km² | 1.232 / km² | 1.298,7 / km² | 1.432 / km² | 1.424 / km² |
Bevölkerungsänderung in Barbianello von 2000 bis 2015
Anstieg um 10.3 % von 2000 bis 2015
| Standort | Änderung seit 1975 | Änderung seit 1990 | Änderung seit 2000 |
|---|---|---|---|
| Barbianello | +25.8% | +16.2% | +10.3% |
| Italien | +8.3% | +4.9% | +4.7% |
Medianalter von Barbianello
Medianalter: 41.9 Jahre
| Standort | Mittleres Alter | Durchschnittsalter (weiblich) | Durchschnittsalter (männlich) |
|---|---|---|---|
| Barbianello | 41.9 yrs | 42.3 yrs | 41.7 yrs |
| Italien | 40.9 yrs | 41.5 yrs | 40.3 yrs |
Bevölkerungsdichte von Barbianello
Bevölkerungsdichte: 1.424 / km²
| Standort | Bevölkerung | Gebiet | Dichte |
|---|---|---|---|
| Barbianello | 534 | 0,375 km² | 1.424 / km² |
| Italien | 59,3 million | 301.510,7 km² | 197 / km² |
Historische und prognostizierte Bevölkerung von Barbianello
Geschätzte Bevölkerung von 0 bis 2100
- JRC (Gemeinsame Forschungsstelle der Europäischen Kommission) arbeitet an GHS built-up grid
- CIESIN (Center for International Earth Science Information Network)
- [Verknüpfung] Klein Goldewijk, K., Beusen, A., Doelman, J., and Stehfest, E.: Anthropogenic land use estimates for the Holocene – HYDE 3.2, Earth Syst. Sci. Data, 9, 927–953, https://doi.org/10.5194/essd-9-927-2017, 2017.
Price Distribution
Geschäftsverteilung nach Preis für Barbianello
Human Development Index (HDI)
Statistischer zusammengesetzter Index der Lebenserwartung, der Bildung und des Pro-Kopf-Einkommens.
CO2-Emissionen von Barbianello
Kohlendioxid (CO2) -Emissionen pro Kopf in Tonnen pro Jahr
| Standort | CO2-Emissionen | CO2-Emissionen pro Kopf | Intensität der CO2-Emissionen |
|---|---|---|---|
| Barbianello | 4,215 tn | 7.89 tn | 11,239 tons/km² |
| Italien | 399,008,505 tn | 6.73 tn | 1,323.4 tons/km² |
| CO2-Emissionen 2013 (Tonnen/Jahr) | 4,215 tn |
| CO2-Emissionen 2013 (Tonnen/Jahr) pro Kopf | 7.89 tn |
| CO2-Emissionsintensität 2013 (Tonnen/km²/Jahr) | 11,239 tons/km² |
Naturgefahrenrisiko
Relatives Risiko von 10
| Gefahr | Risikostufe |
|---|---|
| Flut | Hoch (8) |
| Erdbeben | Mittel (4) |
* Das Risiko, insbesondere in Bezug auf Überschwemmungen oder Erdrutsche, gilt möglicherweise nicht für das gesamte Gebiet.
- Dilley, M., R.S. Chen, U. Deichmann, A.L. Lerner-Lam, M. Arnold, J. Agwe, P. Buys, O. Kjekstad, B. Lyon, and G. Yetman. 2005. Natural Disaster Hotspots: A Global Risk Analysis. Washington, D.C.: World Bank. https://doi.org/10.1596/0-8213-5930-4.
- Center for Hazards and Risk Research - CHRR - Columbia University, Center for International Earth Science Information Network - CIESIN - Columbia University. 2005. Global Flood Hazard Frequency and Distribution. Palisades, NY: NASA Socioeconomic Data and Applications Center (SEDAC). https://doi.org/10.7927/H4668B3D.
- Center for Hazards and Risk Research - CHRR - Columbia University, Center for International Earth Science Information Network - CIESIN - Columbia University. 2005. Global Earthquake Hazard Distribution - Peak Ground Acceleration. Palisades, NY: NASA Socioeconomic Data and Applications Center (SEDAC). https://doi.org/10.7927/H4BZ63ZS.
Aktuelle Erdbeben in der Nähe
Magnitude 3.0 und höher
| Datum▼ | Zeit↕ | Magnitude↕ | Distance↕ | Tiefe↕ | Standort↕ | Verknüpfung |
|---|---|---|---|---|---|---|
| 11/30/14 | 9:34 AM | 4 | 58.9 km | 12,000 m | 3km NNW of Santo Stefano d'Aveto, Italy | usgs.gov |
| 11/14/13 | 11:34 AM | 3.1 | 63.4 km | 10,600 m | 3km NNW of Mignanego, Italy | usgs.gov |
| 10/3/12 | 2:41 PM | 4.5 | 55.7 km | 21,800 m | northern Italy | usgs.gov |
| 3/5/12 | 3:15 PM | 4.7 | 59 km | 9,200 m | northern Italy | usgs.gov |
| 10/20/11 | 6:11 AM | 4.2 | 58.2 km | 24,700 m | northern Italy | usgs.gov |
| 10/20/11 | 6:10 AM | 4.2 | 63.3 km | 10,000 m | northern Italy | usgs.gov |
| 12/5/07 | 4:34 PM | 3.2 | 35 km | 3,300 m | northern Italy | usgs.gov |
| 9/17/07 | 6:43 PM | 3.3 | 38.1 km | 36,000 m | northern Italy | usgs.gov |
| 7/11/07 | 8:43 AM | 3.1 | 56.3 km | 3,000 m | northern Italy | usgs.gov |
| 4/22/06 | 5:02 AM | 3.5 | 18.5 km | 10,000 m | northern Italy | usgs.gov |
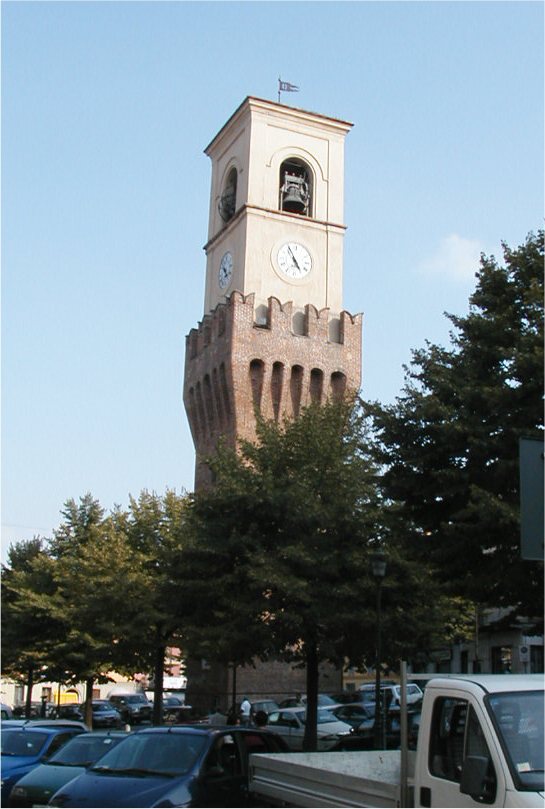
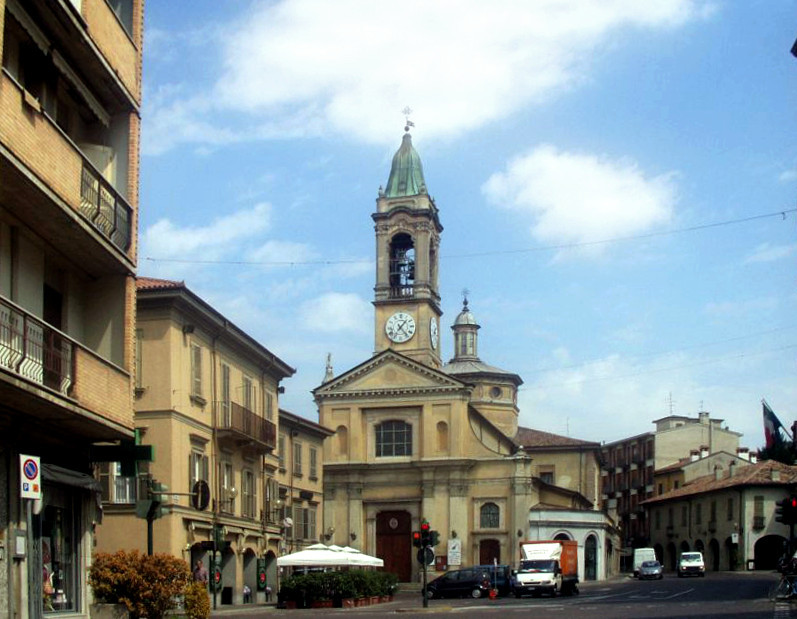
Barbianello
Barbianello ist eine norditalienische Gemeinde (comune) mit 891 Einwohnern (Stand 31. Dezember 2013) in der Lombardei. Die Gemeinde liegt etwa 13 Kilometer südsüdöstlich von Pavia. Durch Barbianello fließt der Scuropasso.
Barbianello Wikipedia-Seite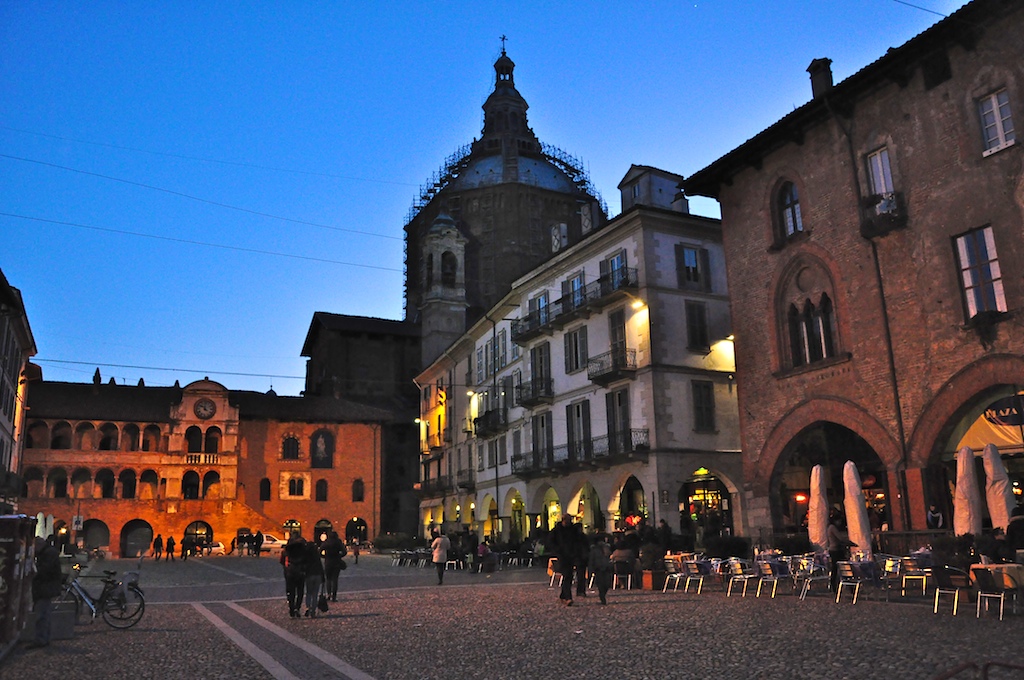
Über unsere Daten
Die Daten auf dieser Seite werden anhand verschiedener öffentlich zugänglicher Werkzeuge und Quellen geschätzt. Sie werden ohne Gewähr bereitgestellt und können Ungenauigkeiten enthalten. Nutzung auf eigene Gefahr.