Battifollo Facts
| Gebiet | 12.8 km² |
| Bevölkerung | 209 |
| Männliche Bevölkerung | 111 (53.0%) |
| Weibliche Bevölkerung | 98 (47.0%) |
| Population change (1975 to 2020) | -44.3% |
| Population change (2000 to 2020) | -22.3% |
| Mittleres Alter | 48.9 years (Male: 46.7, Female: 52.2) |
| BIP pro Kopf (KKP) | $49.699 (2022) |
| Stadtviertel | Battifolle |
| Zeit vor Ort | |
| Zeitzone | Mitteleuropäische Sommerzeit |
| Geogr. Länge & Breite | 44.31983, 8.01094 |
Karte von Battifollo
Interaktive Karte
Bevölkerung von Battifollo
Jahre 1975 bis 2030
| Data | 1975 | 1990 | 2000 | 2015 | 2020 | 2025* | 2030* |
|---|---|---|---|---|---|---|---|
| Bevölkerung | 375 | 311 | 269 | 221 | 209 | 201 | 192 |
| Bevölkerungsdichte | 29,3 / km² | 24,3 / km² | 21 / km² | 17,2 / km² | 16,3 / km² | 15,7 / km² | 15 / km² |
Bevölkerungsänderung in Battifollo von 2000 bis 2020
Rückgang um 22.3 % von 2000 bis 2020
| Standort | Änderung seit 1975 | Änderung seit 1990 | Änderung seit 2000 |
|---|---|---|---|
| Battifollo | -44.3% | -32.8% | -22.3% |
| Italien | — | — | — |
Medianalter von Battifollo
Medianalter: 48.9 Jahre
| Standort | Mittleres Alter | Durchschnittsalter (weiblich) | Durchschnittsalter (männlich) |
|---|---|---|---|
| Battifollo | 48.9 yrs | 52.2 yrs | 46.7 yrs |
| Italien | 40.9 yrs | 41.5 yrs | 40.3 yrs |
Bevölkerungsdichte von Battifollo
Bevölkerungsdichte: 16,3 / km²
| Standort | Bevölkerung | Gebiet | Dichte |
|---|---|---|---|
| Battifollo | 209 | 12,8 km² | 16,3 / km² |
| Italien | 59,3 million | 301.510,7 km² | 197 / km² |
Historische und prognostizierte Bevölkerung von Battifollo
Geschätzte Bevölkerung von 0 bis 2100
- JRC (Gemeinsame Forschungsstelle der Europäischen Kommission) arbeitet an GHS built-up grid
- CIESIN (Center for International Earth Science Information Network)
- [Verknüpfung] Klein Goldewijk, K., Beusen, A., Doelman, J., and Stehfest, E.: Anthropogenic land use estimates for the Holocene – HYDE 3.2, Earth Syst. Sci. Data, 9, 927–953, https://doi.org/10.5194/essd-9-927-2017, 2017.
Postleitzahlen
Prozentsatz der Unternehmen nach Postleitzahl in Battifollo
Price Distribution
Geschäftsverteilung nach Preis für Battifollo
Human Development Index (HDI)
Statistischer zusammengesetzter Index der Lebenserwartung, der Bildung und des Pro-Kopf-Einkommens.
Bruttoinlandsprodukt (BIP) von Battifollo
BIP pro Kopf, KKP (konstante internationale $ von 2017)
| Data | 1990 | 1995 | 2000 | 2005 | 2010 | 2015 | 2020 | 2022 |
|---|---|---|---|---|---|---|---|---|
| BIP pro Kopf | $38.005 | $40.425 | $44.645 | $50.700 | $46.520 | $43.940 | $43.931 | $49.699 |
| BIP insgesamt | $240,6 Mio. | $257,2 Mio. | $283,2 Mio. | $325,8 Mio. | $304 Mio. | $278,9 Mio. | $264,7 Mio. | $294,6 Mio. |
CO2-Emissionen von Battifollo
Kohlendioxid (CO2) -Emissionen pro Kopf in Tonnen pro Jahr
| Standort | CO2-Emissionen | CO2-Emissionen pro Kopf | Intensität der CO2-Emissionen |
|---|---|---|---|
| Battifollo | 1,695 tn | 8.11 tn | 132.3 tons/km² |
| Italien | 399,008,505 tn | 6.73 tn | 1,323.4 tons/km² |
| CO2-Emissionen 2013 (Tonnen/Jahr) | 1,695 tn |
| CO2-Emissionen 2013 (Tonnen/Jahr) pro Kopf | 8.11 tn |
| CO2-Emissionsintensität 2013 (Tonnen/km²/Jahr) | 132.3 tons/km² |
Naturgefahrenrisiko
Relatives Risiko von 10
| Gefahr | Risikostufe |
|---|---|
| Flut | Hoch (8) |
| Erdbeben | Mittel (4) |
| Erdrutsch | Mittel (6) |
* Das Risiko, insbesondere in Bezug auf Überschwemmungen oder Erdrutsche, gilt möglicherweise nicht für das gesamte Gebiet.
- Dilley, M., R.S. Chen, U. Deichmann, A.L. Lerner-Lam, M. Arnold, J. Agwe, P. Buys, O. Kjekstad, B. Lyon, and G. Yetman. 2005. Natural Disaster Hotspots: A Global Risk Analysis. Washington, D.C.: World Bank. https://doi.org/10.1596/0-8213-5930-4.
- Center for Hazards and Risk Research - CHRR - Columbia University, Center for International Earth Science Information Network - CIESIN - Columbia University, and Norwegian Geotechnical Institute - NGI. 2005. Global Landslide Hazard Distribution. Palisades, NY: NASA Socioeconomic Data and Applications Center (SEDAC). https://doi.org/10.7927/H4P848VZ.
- Center for Hazards and Risk Research - CHRR - Columbia University, Center for International Earth Science Information Network - CIESIN - Columbia University. 2005. Global Flood Hazard Frequency and Distribution. Palisades, NY: NASA Socioeconomic Data and Applications Center (SEDAC). https://doi.org/10.7927/H4668B3D.
- Center for Hazards and Risk Research - CHRR - Columbia University, Center for International Earth Science Information Network - CIESIN - Columbia University. 2005. Global Earthquake Hazard Distribution - Peak Ground Acceleration. Palisades, NY: NASA Socioeconomic Data and Applications Center (SEDAC). https://doi.org/10.7927/H4BZ63ZS.
Aktuelle Erdbeben in der Nähe
Magnitude 3.0 und höher
| Datum▼ | Zeit↕ | Magnitude↕ | Distance↕ | Tiefe↕ | Standort↕ | Verknüpfung |
|---|---|---|---|---|---|---|
| 4/19/09 | 12:39 PM | 4.5 | 47.1 km | 40,200 m | northern Italy | usgs.gov |
| 7/6/08 | 9:26 AM | 3 | 23.6 km | 8,300 m | northern Italy | usgs.gov |
| 7/6/08 | 8:08 AM | 3 | 12.1 km | 10,000 m | northern Italy | usgs.gov |
| 6/11/08 | 3:17 PM | 3.4 | 60.9 km | 13,100 m | Ligurian Sea | usgs.gov |
| 3/27/08 | 6:41 AM | 3.3 | 28.6 km | 11,400 m | northern Italy | usgs.gov |
| 2/20/08 | 4:05 AM | 3.2 | 51.4 km | 7,900 m | near the south coast of France | usgs.gov |
| 9/11/06 | 3:04 PM | 3.6 | 36.9 km | 55,400 m | northern Italy | usgs.gov |
| 9/2/06 | 1:21 AM | 4.3 | 48.7 km | 2,000 m | near the south coast of France | usgs.gov |
| 2/16/06 | 5:38 PM | 3 | 45.4 km | 5,000 m | northern Italy | usgs.gov |
| 4/9/05 | 6:09 PM | 3 | 48.4 km | 8,800 m | northern Italy | usgs.gov |
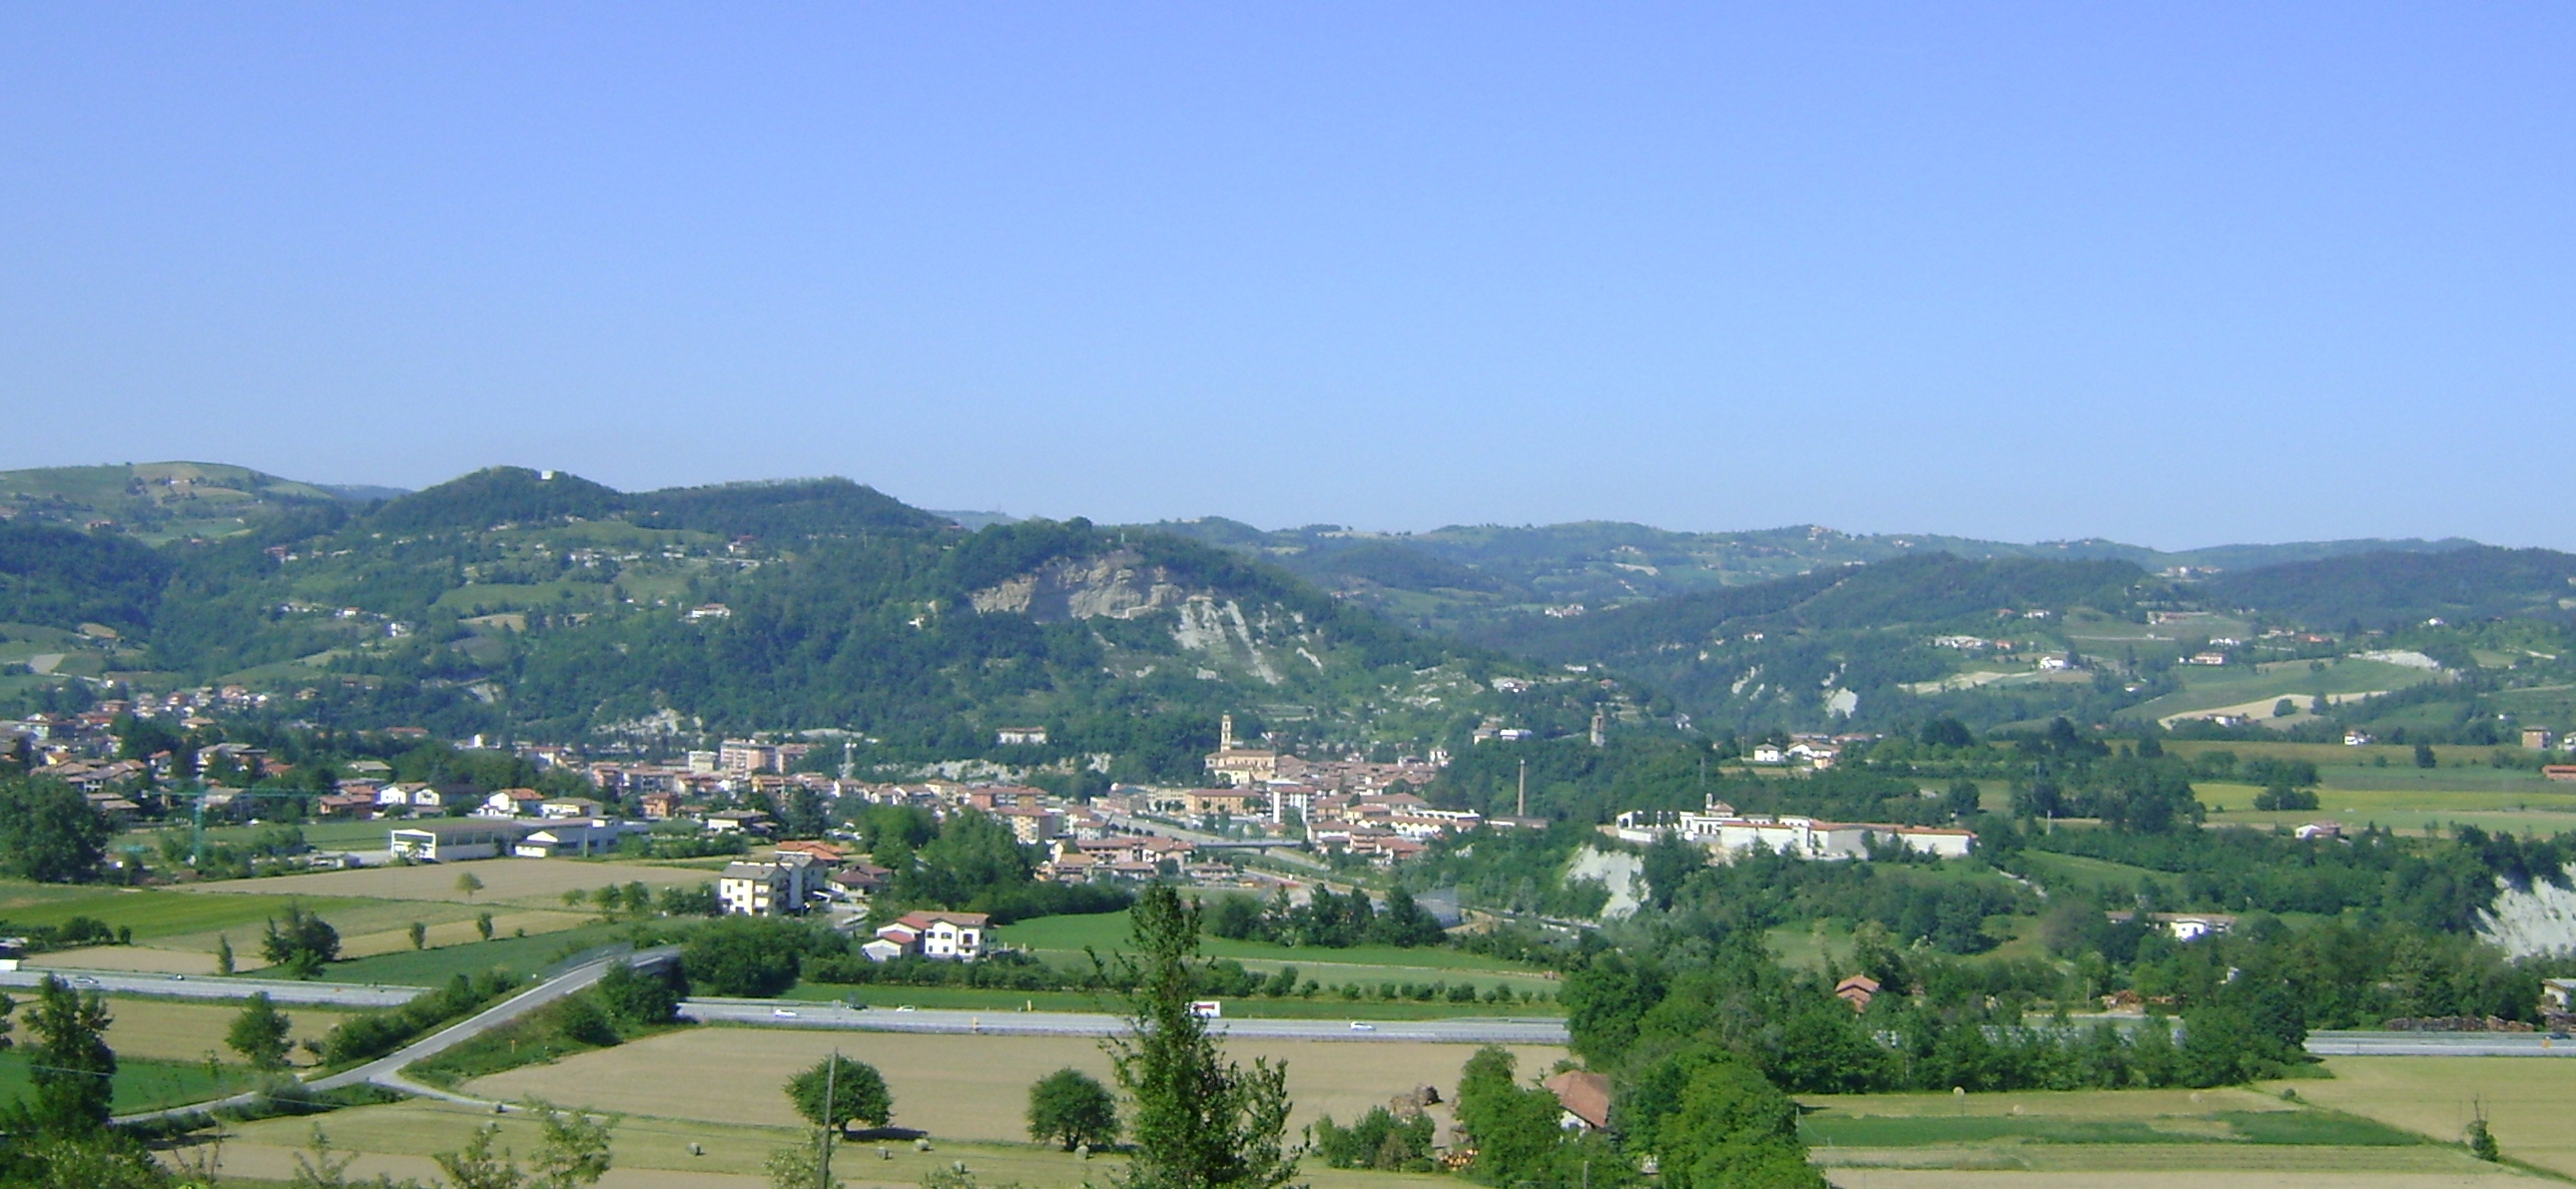
Battifollo
Battifollo (piemontesisch Batifòl) ist eine Gemeinde mit 227 Einwohnern (Stand 31. Dezember 2013) in der italienischen Provinz Cuneo (CN), Region Piemont. ist Mitglied der Verwaltungsgemeinschaft Comunità Montana Valli Mongia, Cevetta e Langa Cebana. Die Nach..
Battifollo Wikipedia-Seite

Über unsere Daten
Die Daten auf dieser Seite werden anhand verschiedener öffentlich zugänglicher Werkzeuge und Quellen geschätzt. Sie werden ohne Gewähr bereitgestellt und können Ungenauigkeiten enthalten. Nutzung auf eigene Gefahr.