Kategorien in Kure
Branchen
Unternehmensverteilung nach Branche in Kure
| Branchenbeschreibung | Anzahl der Betriebe |
|---|---|
| Hochbau | 370 |
| Restaurants | 301 |
| Einkaufen | 192 |
| Öffentliche Verwaltung | 191 |
| Friseure | 163 |
| Busse und Züge | 162 |
| Unternehmensleitung | 102 |
| Gesundheit und Medizin | 97 |
| Immobilien | 93 |
| Gemischtwarenladen | 90 |
| Religion | 87 |
Kure Facts
| Gebiet | 41.4 km² |
| Bevölkerung | 124.630 |
| Männliche Bevölkerung | 59.950 (48.1%) |
| Weibliche Bevölkerung | 64.680 (51.9%) |
| Population change (1975 to 2020) | +41.1% |
| Population change (2000 to 2020) | +43.2% |
| Mittleres Alter | 50.3 years (Male: 47, Female: 53.4) |
| BIP pro Kopf (KKP) | $37.978 (2022) |
| Vorwahlen | 823 |
| Stadtviertel | Showacho, Takaramachi, Nakadori, 3 Chome, Nakadori, 4 Chome, Hondori, 4 Chome |
| Zeit vor Ort | |
| Zeitzone | Japanische Normalzeit |
| Geogr. Länge & Breite | 34.23222, 132.56658 |
| Postleitzahlen | 731, 737 |
Karte von Kure
Interaktive Karte
Bevölkerung von Kure
Jahre 1975 bis 2030
| Data | 1975 | 1990 | 2000 | 2015 | 2020 | 2025* | 2030* |
|---|---|---|---|---|---|---|---|
| Bevölkerung | 88.355 | 91.157 | 87.043 | 81.160 | 124.630 | 125.483 | 125.449 |
| Bevölkerungsdichte | 2.135,5 / km² | 2.203,2 / km² | 2.103,8 / km² | 1.961,6 / km² | 3.012,2 / km² | 3.032,8 / km² | 3.032 / km² |
Bevölkerungsänderung in Kure von 2000 bis 2020
Anstieg um 43.2 % von 2000 bis 2020
| Standort | Änderung seit 1975 | Änderung seit 1990 | Änderung seit 2000 |
|---|---|---|---|
| Kure | +41.1% | +36.7% | +43.2% |
| Präfektur Hiroshima | — | — | — |
| Japan | — | — | — |
Medianalter von Kure
Medianalter: 50.3 Jahre
| Standort | Mittleres Alter | Durchschnittsalter (weiblich) | Durchschnittsalter (männlich) |
|---|---|---|---|
| Kure | 50.3 yrs | 53.4 yrs | 47 yrs |
| Präfektur Hiroshima | 45.6 yrs | 47.6 yrs | 43.7 yrs |
| Japan | 45.1 yrs | 46.9 yrs | 43.5 yrs |
Bevölkerungsdichte von Kure
Bevölkerungsdichte: 3.012 / km²
| Standort | Bevölkerung | Gebiet | Dichte |
|---|---|---|---|
| Kure | 124.630 | 41,4 km² | 3.012 / km² |
| Präfektur Hiroshima | 2,7 million | 8.469,7 km² | 321 / km² |
| Japan | 122,9 million | 373.410,9 km² | 329 / km² |
Historische und prognostizierte Bevölkerung von Kure
Geschätzte Bevölkerung von 1300 bis 2100
- JRC (Gemeinsame Forschungsstelle der Europäischen Kommission) arbeitet an GHS built-up grid
- CIESIN (Center for International Earth Science Information Network)
- [Verknüpfung] Klein Goldewijk, K., Beusen, A., Doelman, J., and Stehfest, E.: Anthropogenic land use estimates for the Holocene – HYDE 3.2, Earth Syst. Sci. Data, 9, 927–953, https://doi.org/10.5194/essd-9-927-2017, 2017.
Stadtteile in Kure
Prozentsatz der Unternehmen nach Stadtteil in Kure
Price Distribution
Geschäftsverteilung nach Preis für Kure
Human Development Index (HDI)
Statistischer zusammengesetzter Index der Lebenserwartung, der Bildung und des Pro-Kopf-Einkommens.
Bruttoinlandsprodukt (BIP) von Kure
BIP pro Kopf, KKP (konstante internationale $ von 2017)
| Data | 1990 | 1995 | 2000 | 2005 | 2010 | 2015 | 2020 | 2022 |
|---|---|---|---|---|---|---|---|---|
| BIP pro Kopf | $25.587 | $32.615 | $30.073 | $38.661 | $34.937 | $41.567 | $34.826 | $37.978 |
| BIP insgesamt | $1,9 Mrd. | $2,4 Mrd. | $2,3 Mrd. | $2,9 Mrd. | $2,6 Mrd. | $3,1 Mrd. | $2,6 Mrd. | $2,8 Mrd. |
CO2-Emissionen von Kure
Kohlendioxid (CO2) -Emissionen pro Kopf in Tonnen pro Jahr
| Standort | CO2-Emissionen | CO2-Emissionen pro Kopf | Intensität der CO2-Emissionen |
|---|---|---|---|
| Kure | 466,033 tn | 3.74 tn | 11,263.6 tons/km² |
| Präfektur Hiroshima | 977,270 tn | 0.36 tn | 115.4 tons/km² |
| Japan | 541,995,101 tn | 4.41 tn | 1,451.5 tons/km² |
| CO2-Emissionen 2013 (Tonnen/Jahr) | 466,033 tn |
| CO2-Emissionen 2013 (Tonnen/Jahr) pro Kopf | 3.74 tn |
| CO2-Emissionsintensität 2013 (Tonnen/km²/Jahr) | 11,263.6 tons/km² |
Naturgefahrenrisiko
Relatives Risiko von 10
| Gefahr | Risikostufe |
|---|---|
| Flut | Mittel (7) |
| Erdbeben | Mittel (5.4) |
| Zyklon | Hoch (10) |
* Das Risiko, insbesondere in Bezug auf Überschwemmungen oder Erdrutsche, gilt möglicherweise nicht für das gesamte Gebiet.
- Dilley, M., R.S. Chen, U. Deichmann, A.L. Lerner-Lam, M. Arnold, J. Agwe, P. Buys, O. Kjekstad, B. Lyon, and G. Yetman. 2005. Natural Disaster Hotspots: A Global Risk Analysis. Washington, D.C.: World Bank. https://doi.org/10.1596/0-8213-5930-4.
- Center for Hazards and Risk Research - CHRR - Columbia University, Center for International Earth Science Information Network - CIESIN - Columbia University, International Bank for Reconstruction and Development - The World Bank, and United Nations Environment Programme Global Resource Information Database Geneva - UNEP/GRID-Geneva. 2005. Global Cyclone Hazard Frequency and Distribution. Palisades, NY: NASA Socioeconomic Data and Applications Center (SEDAC). https://doi.org/10.7927/H4CZ353K.
- Center for Hazards and Risk Research - CHRR - Columbia University, Center for International Earth Science Information Network - CIESIN - Columbia University. 2005. Global Flood Hazard Frequency and Distribution. Palisades, NY: NASA Socioeconomic Data and Applications Center (SEDAC). https://doi.org/10.7927/H4668B3D.
- Center for Hazards and Risk Research - CHRR - Columbia University, Center for International Earth Science Information Network - CIESIN - Columbia University. 2005. Global Earthquake Hazard Distribution - Peak Ground Acceleration. Palisades, NY: NASA Socioeconomic Data and Applications Center (SEDAC). https://doi.org/10.7927/H4BZ63ZS.
Aktuelle Erdbeben in der Nähe
Magnitude 3.0 und höher
| Datum▼ | Zeit↕ | Magnitude↕ | Distance↕ | Tiefe↕ | Standort↕ | Verknüpfung |
|---|---|---|---|---|---|---|
| 6/26/18 | 8:00 AM | 4.6 | 74.5 km | 35,340 m | 8km NNW of Miyoshi, Japan | usgs.gov |
| 4/8/18 | 8:05 PM | 4.5 | 93.3 km | 10,000 m | 13km SSE of Oda, Japan | usgs.gov |
| 4/8/18 | 5:10 PM | 4.6 | 96.8 km | 10,000 m | 8km S of Oda, Japan | usgs.gov |
| 4/8/18 | 4:43 PM | 4.4 | 93.5 km | 9,590 m | 12km S of Oda, Japan | usgs.gov |
| 1/8/18 | 8:52 PM | 4.6 | 68.2 km | 58,940 m | 27km S of Yanai, Japan | usgs.gov |
| 8/15/17 | 7:38 PM | 4.5 | 59.4 km | 58,110 m | 11km S of Yanai, Japan | usgs.gov |
| 6/14/17 | 10:24 AM | 4.4 | 86.7 km | 26,780 m | 13km SSE of Niihama, Japan | usgs.gov |
| 7/24/15 | 8:53 AM | 4.6 | 93.1 km | 44,110 m | 18km WSW of Ozu, Japan | usgs.gov |
| 4/7/15 | 11:51 PM | 4.3 | 70.5 km | 49,710 m | 10km N of Ozu, Japan | usgs.gov |
| 2/3/15 | 5:07 AM | 4.5 | 82.2 km | 52,980 m | 17km E of Ozu, Japan | usgs.gov |
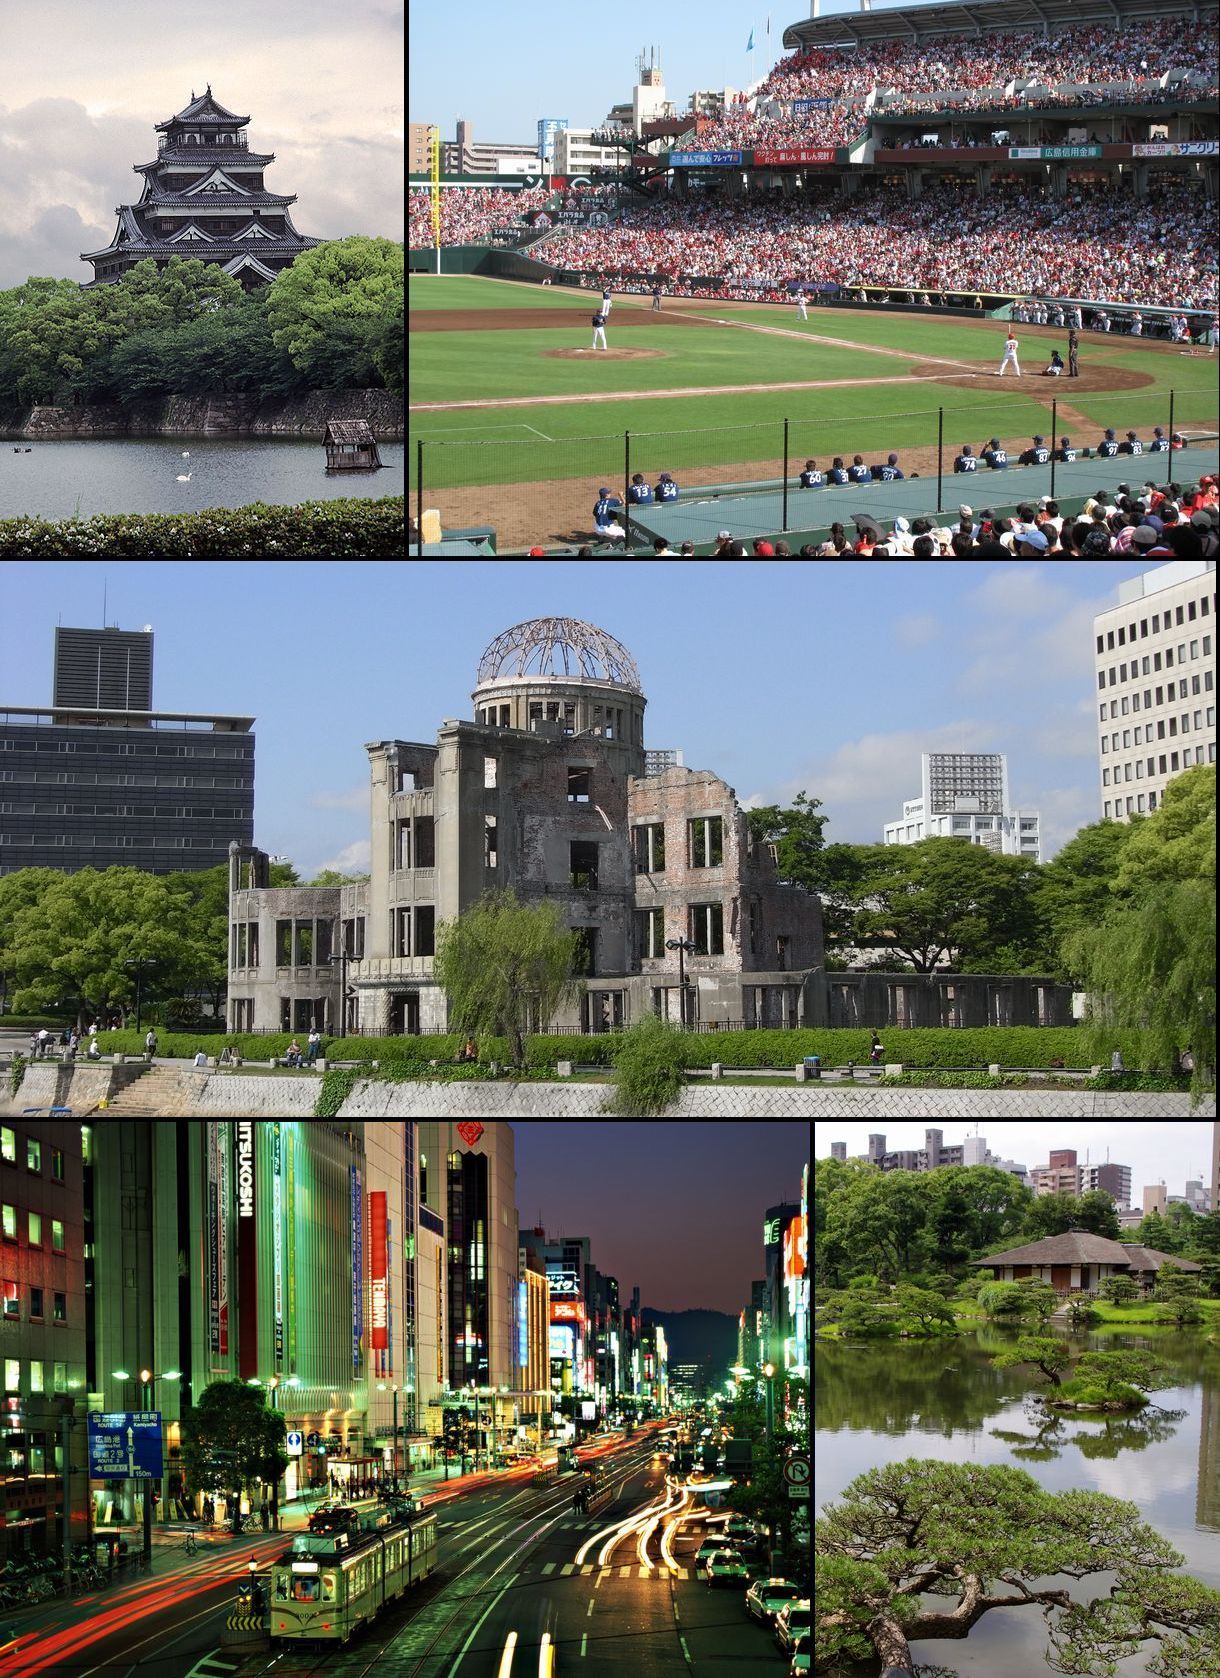
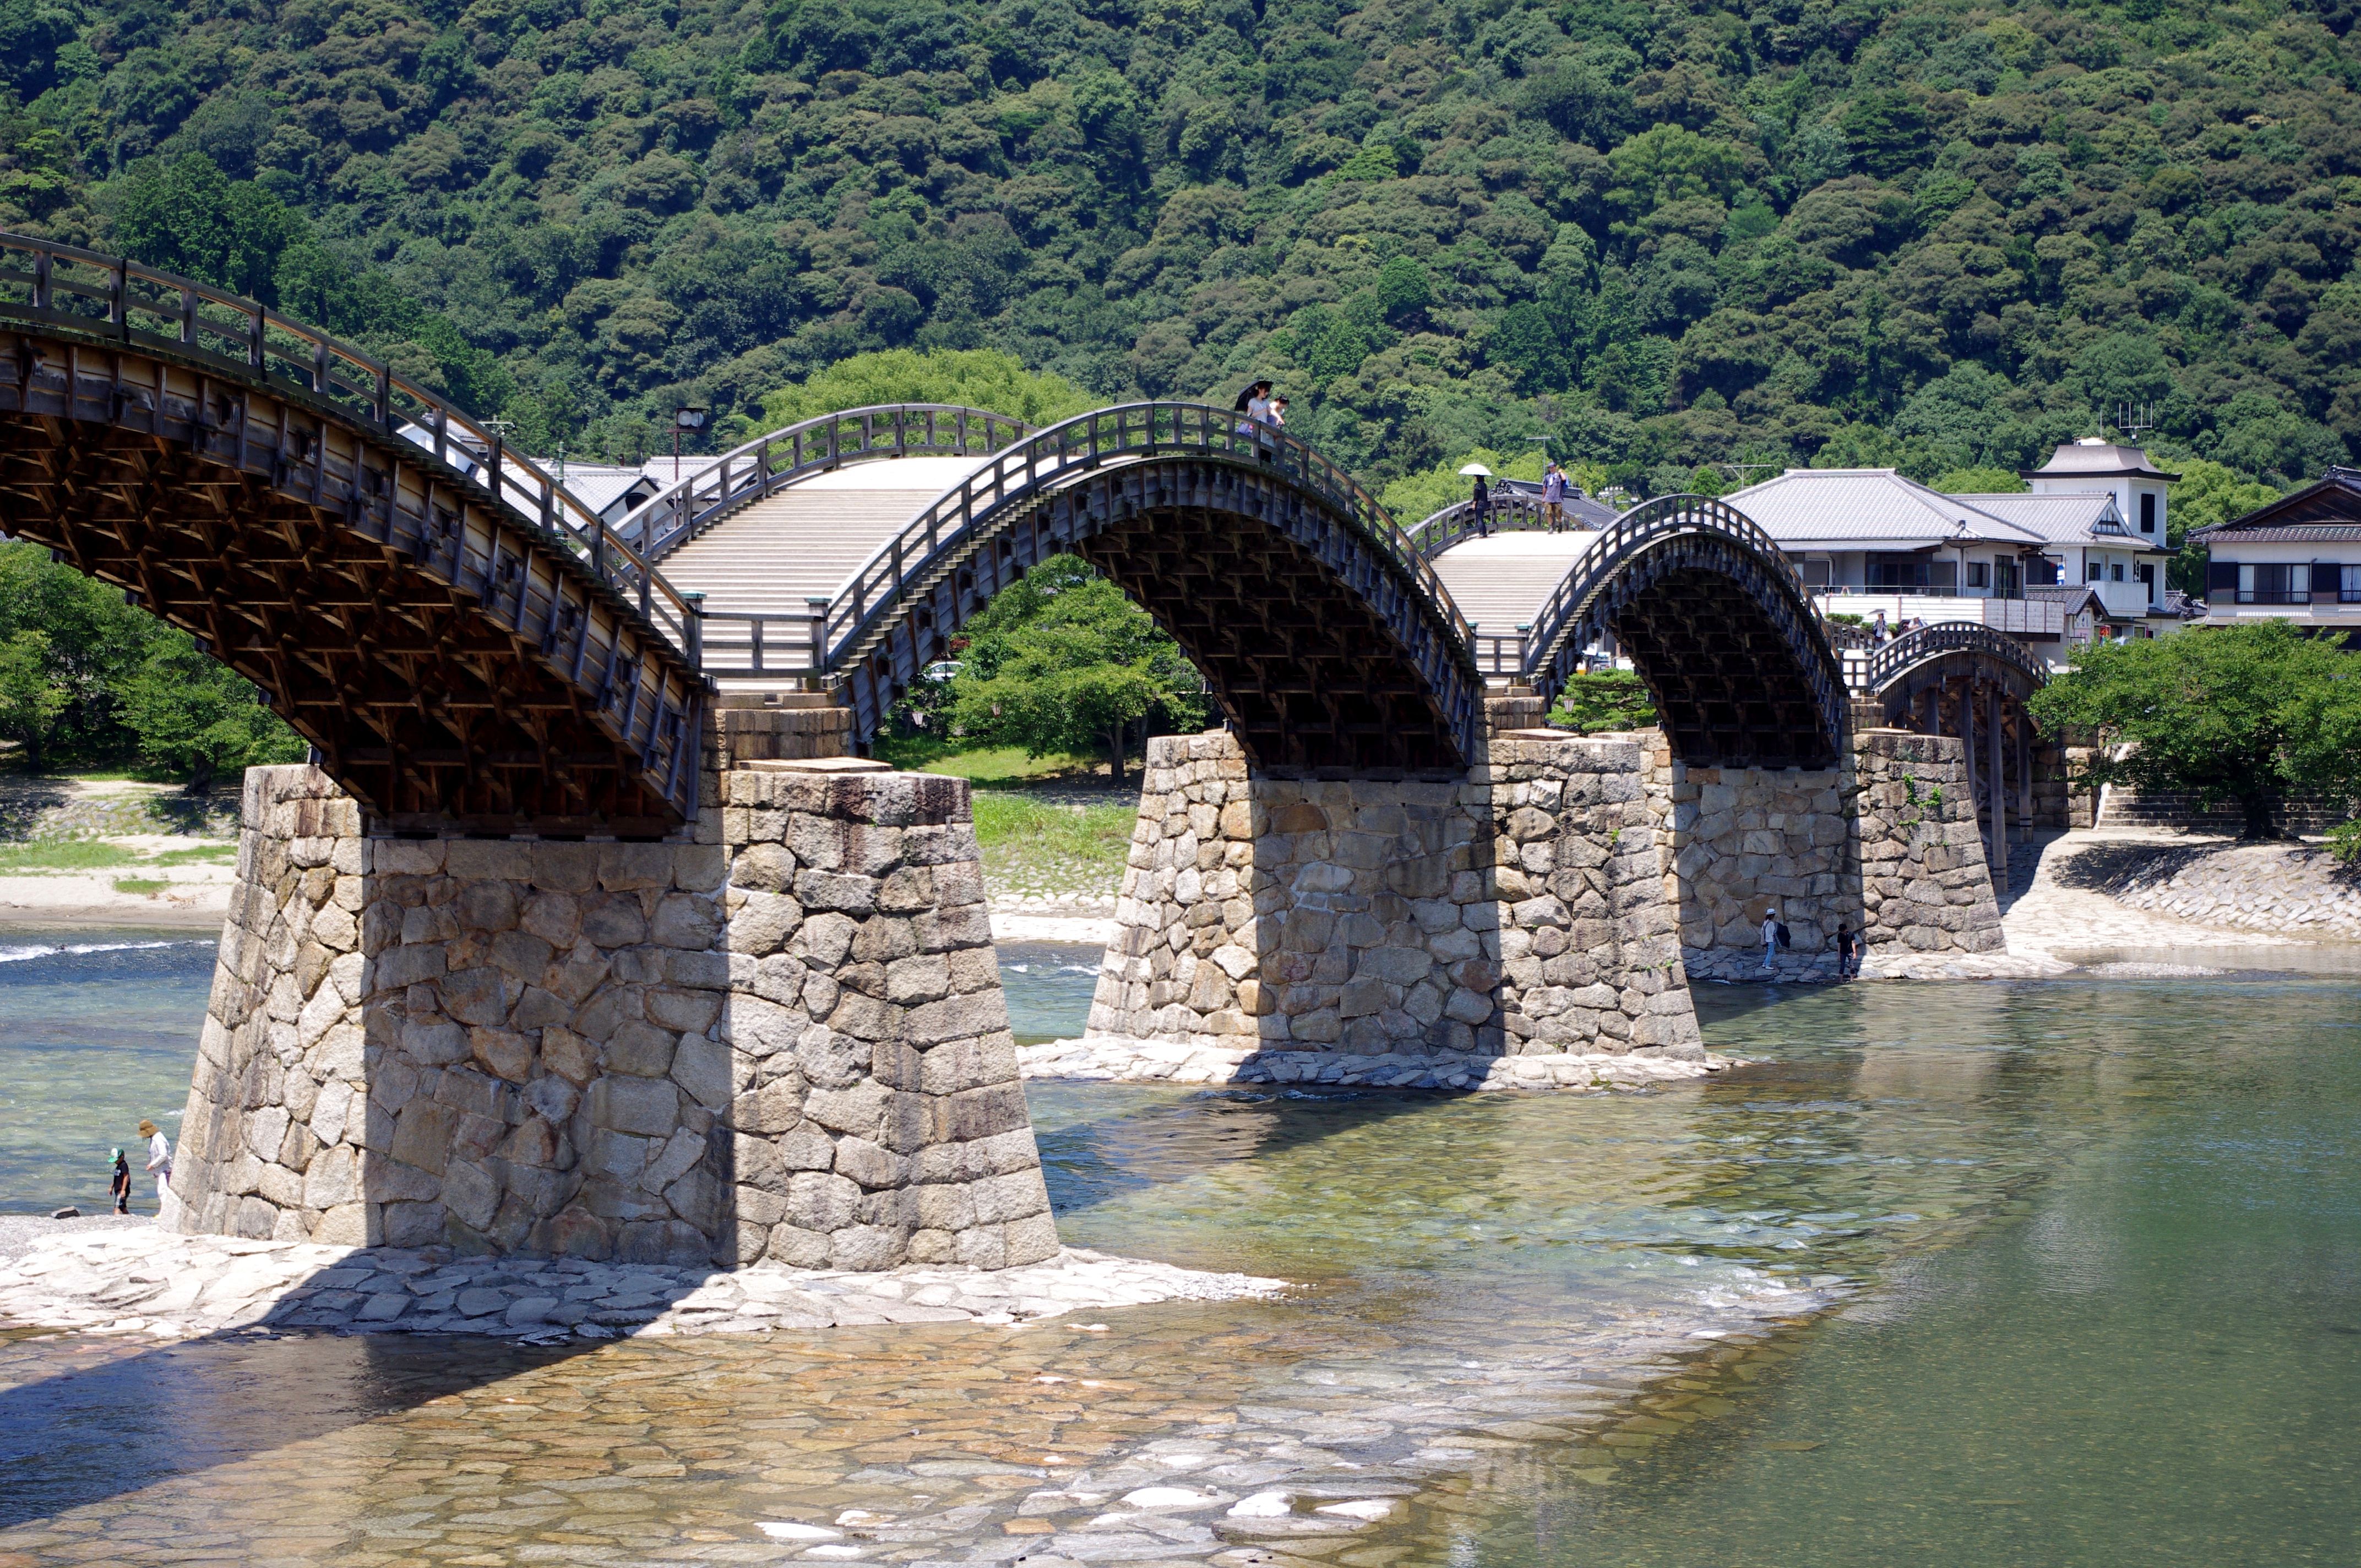
Kure
Kure (jap. 呉市, -shi) ist eine Stadt in der Präfektur Hiroshima im Südwesten von Honshū, der Hauptinsel von Japan.
Kure Wikipedia-Seite

Über unsere Daten
Die Daten auf dieser Seite werden anhand verschiedener öffentlich zugänglicher Werkzeuge und Quellen geschätzt. Sie werden ohne Gewähr bereitgestellt und können Ungenauigkeiten enthalten. Nutzung auf eigene Gefahr.