Kategorien in Comala
Branchen
Unternehmensverteilung nach Branche in Comala
| Branchenbeschreibung | Anzahl der Betriebe |
|---|---|
| Restaurants | 78 |
| Sonstige Beherbergungsstätten | 30 |
| Lebensmittelläden und Supermärkte | 29 |
| Einkaufen | 20 |
| Cafés | 20 |
| Erziehung und Unterricht | 18 |
| Öffentliche Verwaltung | 15 |
| Hotels und Motels | 14 |
| Campingplätze | 13 |
| Öffentliche Parkanlagen | 11 |
| Mexikanische Restaurants | 10 |
| Kirchen | 9 |
| Museen | 9 |
Comala Facts
| Gebiet | 5.1 km² |
| Bevölkerung | 8.789 |
| Männliche Bevölkerung | 4.359 (49.6%) |
| Weibliche Bevölkerung | 4.430 (50.4%) |
| Population change (1975 to 2020) | +79.0% |
| Population change (2000 to 2020) | -0.6% |
| Mittleres Alter | 30.8 years (Male: 29.3, Female: 32.4) |
| BIP pro Kopf (KKP) | $30.135 (2022) |
| Vorwahlen | 346 |
| Stadtviertel | Centro, La Trinidad, Alto, Nogueras, Los Aguajes |
| Zeit vor Ort | |
| Zeitzone | Nordamerikanische Zentral-Normalzeit |
| Geogr. Länge & Breite | 19.32717, -103.75926 |
| Postleitzahlen | 28450, 28452, 28454, 28455, 28457, More |
Karte von Comala
Interaktive Karte
Bevölkerung von Comala
Jahre 1975 bis 2030
| Data | 1975 | 1990 | 2000 | 2015 | 2020 | 2025* | 2030* |
|---|---|---|---|---|---|---|---|
| Bevölkerung | 4.911 | 7.197 | 8.842 | 10.191 | 8.789 | 9.437 | 9.989 |
| Bevölkerungsdichte | 958,2 / km² | 1.404,3 / km² | 1.725,3 / km² | 1.988,5 / km² | 1.714,9 / km² | 1.841,4 / km² | 1.949,1 / km² |
Bevölkerungsänderung in Comala von 2000 bis 2020
Rückgang um 0.6 % von 2000 bis 2020
| Standort | Änderung seit 1975 | Änderung seit 1990 | Änderung seit 2000 |
|---|---|---|---|
| Comala | +79% | +22.1% | -0.6% |
| Colima (Bundesstaat) | — | — | — |
| Mexiko | — | — | — |
Medianalter von Comala
Medianalter: 30.8 Jahre
| Standort | Mittleres Alter | Durchschnittsalter (weiblich) | Durchschnittsalter (männlich) |
|---|---|---|---|
| Comala | 30.8 yrs | 32.4 yrs | 29.3 yrs |
| Colima (Bundesstaat) | 27.1 yrs | 27.6 yrs | 26.5 yrs |
| Mexiko | 26.2 yrs | 27 yrs | 25.3 yrs |
Bevölkerungsdichte von Comala
Bevölkerungsdichte: 1.715 / km²
| Standort | Bevölkerung | Gebiet | Dichte |
|---|---|---|---|
| Comala | 8.789 | 5,1 km² | 1.715 / km² |
| Colima (Bundesstaat) | 766.209 | 5.784,2 km² | 133 / km² |
| Mexiko | 126,8 million | 1.965.208 km² | 64,5 / km² |
Historische und prognostizierte Bevölkerung von Comala
Geschätzte Bevölkerung von 0 bis 2100
- JRC (Gemeinsame Forschungsstelle der Europäischen Kommission) arbeitet an GHS built-up grid
- CIESIN (Center for International Earth Science Information Network)
- [Verknüpfung] Klein Goldewijk, K., Beusen, A., Doelman, J., and Stehfest, E.: Anthropogenic land use estimates for the Holocene – HYDE 3.2, Earth Syst. Sci. Data, 9, 927–953, https://doi.org/10.5194/essd-9-927-2017, 2017.
Stadtteile in Comala
Prozentsatz der Unternehmen nach Stadtteil in Comala
Price Distribution
Geschäftsverteilung nach Preis für Comala
Human Development Index (HDI)
Statistischer zusammengesetzter Index der Lebenserwartung, der Bildung und des Pro-Kopf-Einkommens.
Bruttoinlandsprodukt (BIP) von Comala
BIP pro Kopf, KKP (konstante internationale $ von 2017)
| Data | 1990 | 1995 | 2000 | 2005 | 2010 | 2015 | 2020 | 2022 |
|---|---|---|---|---|---|---|---|---|
| BIP pro Kopf | $13.794 | $17.411 | $18.452 | $16.161 | $18.743 | $18.387 | $27.388 | $30.135 |
| BIP insgesamt | $110,7 Mio. | $157,6 Mio. | $186,5 Mio. | $172,4 Mio. | $209,6 Mio. | $220 Mio. | $337,9 Mio. | $381,9 Mio. |
CO2-Emissionen von Comala
Kohlendioxid (CO2) -Emissionen pro Kopf in Tonnen pro Jahr
| Standort | CO2-Emissionen | CO2-Emissionen pro Kopf | Intensität der CO2-Emissionen |
|---|---|---|---|
| Comala | 37,770 tn | 4.3 tn | 7,369.8 tons/km² |
| Colima (Bundesstaat) | 3,151,041 tn | 4.11 tn | 544.8 tons/km² |
| Mexiko | 496,865,013 tn | 3.92 tn | 252.8 tons/km² |
| CO2-Emissionen 2013 (Tonnen/Jahr) | 37,770 tn |
| CO2-Emissionen 2013 (Tonnen/Jahr) pro Kopf | 4.3 tn |
| CO2-Emissionsintensität 2013 (Tonnen/km²/Jahr) | 7,369.8 tons/km² |
Naturgefahrenrisiko
Relatives Risiko von 10
| Gefahr | Risikostufe |
|---|---|
| Dürre | Mittel (7) |
| Flut | Mittel (7) |
| Erdbeben | Hoch (10) |
| Zyklon | Mittel (7) |
| Erdrutsch | Hoch (9) |
| Vulkan | Hoch (9) |
* Das Risiko, insbesondere in Bezug auf Überschwemmungen oder Erdrutsche, gilt möglicherweise nicht für das gesamte Gebiet.
- Dilley, M., R.S. Chen, U. Deichmann, A.L. Lerner-Lam, M. Arnold, J. Agwe, P. Buys, O. Kjekstad, B. Lyon, and G. Yetman. 2005. Natural Disaster Hotspots: A Global Risk Analysis. Washington, D.C.: World Bank. https://doi.org/10.1596/0-8213-5930-4.
- Center for Hazards and Risk Research - CHRR - Columbia University, Center for International Earth Science Information Network - CIESIN - Columbia University, and Norwegian Geotechnical Institute - NGI. 2005. Global Landslide Hazard Distribution. Palisades, NY: NASA Socioeconomic Data and Applications Center (SEDAC). https://doi.org/10.7927/H4P848VZ.
- Center for Hazards and Risk Research - CHRR - Columbia University, Center for International Earth Science Information Network - CIESIN - Columbia University, International Bank for Reconstruction and Development - The World Bank, and United Nations Environment Programme Global Resource Information Database Geneva - UNEP/GRID-Geneva. 2005. Global Cyclone Hazard Frequency and Distribution. Palisades, NY: NASA Socioeconomic Data and Applications Center (SEDAC). https://doi.org/10.7927/H4CZ353K.
- Center for Hazards and Risk Research - CHRR - Columbia University, Center for International Earth Science Information Network - CIESIN - Columbia University, and International Research Institute for Climate and Society - IRI - Columbia University. 2005. Global Drought Hazard Frequency and Distribution. Palisades, NY: NASA Socioeconomic Data and Applications Center (SEDAC). https://doi.org/10.7927/H4VX0DFT.
- Center for Hazards and Risk Research - CHRR - Columbia University, Center for International Earth Science Information Network - CIESIN - Columbia University. 2005. Global Flood Hazard Frequency and Distribution. Palisades, NY: NASA Socioeconomic Data and Applications Center (SEDAC). https://doi.org/10.7927/H4668B3D.
- Center for Hazards and Risk Research - CHRR - Columbia University, Center for International Earth Science Information Network - CIESIN - Columbia University. 2005. Global Volcano Hazard Frequency and Distribution. Palisades, NY: NASA Socioeconomic Data and Applications Center (SEDAC). https://doi.org/10.7927/H4BR8Q45.
- Center for Hazards and Risk Research - CHRR - Columbia University, Center for International Earth Science Information Network - CIESIN - Columbia University. 2005. Global Earthquake Hazard Distribution - Peak Ground Acceleration. Palisades, NY: NASA Socioeconomic Data and Applications Center (SEDAC). https://doi.org/10.7927/H4BZ63ZS.
Aktuelle Erdbeben in der Nähe
Magnitude 3.0 und höher
| Datum▼ | Zeit↕ | Magnitude↕ | Distance↕ | Tiefe↕ | Standort↕ | Verknüpfung |
|---|---|---|---|---|---|---|
| 4/29/17 | 12:41 PM | 4.3 | 40.2 km | 10,000 m | 11km SW of Minatitlan, Mexico | usgs.gov |
| 9/2/15 | 8:25 PM | 4.7 | 63 km | 24,240 m | 12km WNW of Coahuayana, Mexico | usgs.gov |
| 8/31/15 | 6:47 AM | 4.4 | 42.2 km | 21,650 m | 17km ENE of El Colomo, Mexico | usgs.gov |
| 8/12/14 | 2:36 AM | 4.2 | 60.8 km | 10,300 m | 5km N of Coahuayana, Mexico | usgs.gov |
| 12/14/13 | 10:33 PM | 4.1 | 14.1 km | 104,600 m | 8km N of Suchitlan, Mexico | usgs.gov |
| 8/6/13 | 12:49 AM | 3.9 | 58.7 km | 32,100 m | 7km NNW of El Colomo, Mexico | usgs.gov |
| 7/2/13 | 10:36 PM | 4 | 46.3 km | 2,300 m | 9km WNW of Armeria, Mexico | usgs.gov |
| 5/12/13 | 9:55 AM | 4 | 52.2 km | 3,400 m | 24km NE of Coahuayana, Mexico | usgs.gov |
| 10/20/12 | 3:02 AM | 4.2 | 47.4 km | 7,000 m | Colima, Mexico | usgs.gov |
| 11/30/11 | 6:06 PM | 4 | 48.8 km | 6,000 m | Colima, Mexico | usgs.gov |
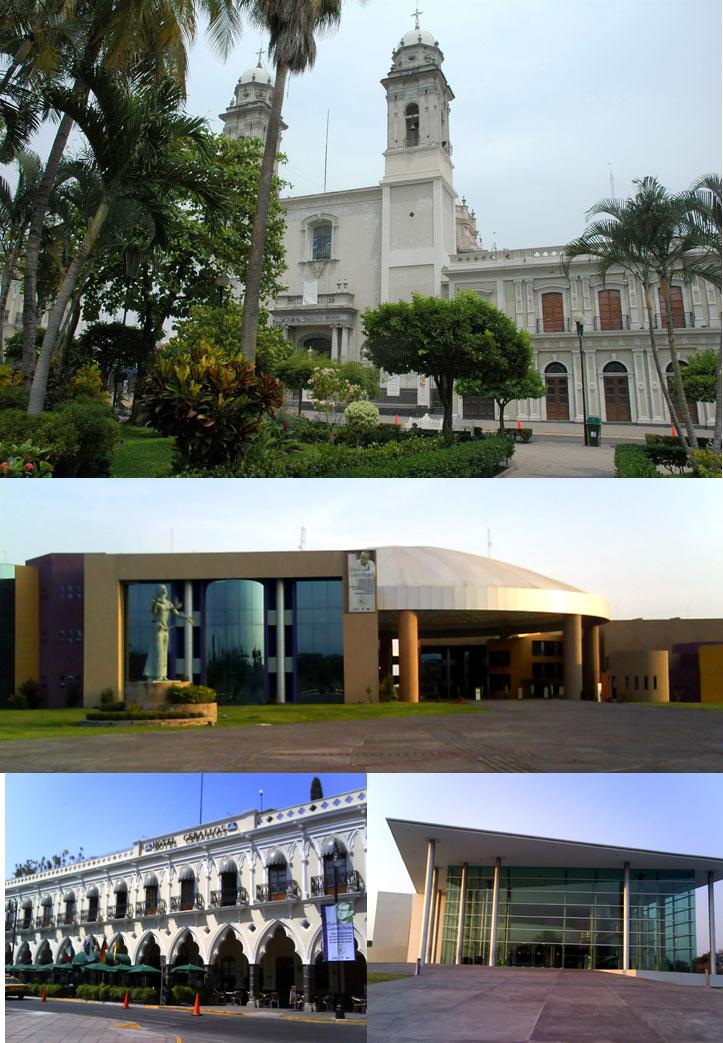
Comala
Comala ist eine Ortschaft im mexikanischen Bundesstaat Colima, Verwaltungssitz des Municipio Comala und im Volksmund auch als der weiße Ort bekannt. Wegen seiner Schönheit wurde er zum Pueblo Mágico erklärt. Hier spielt auch der Roman Pedro Páramo von Juan Rul..
Comala Wikipedia-Seite


Über unsere Daten
Die Daten auf dieser Seite werden anhand verschiedener öffentlich zugänglicher Werkzeuge und Quellen geschätzt. Sie werden ohne Gewähr bereitgestellt und können Ungenauigkeiten enthalten. Nutzung auf eigene Gefahr.