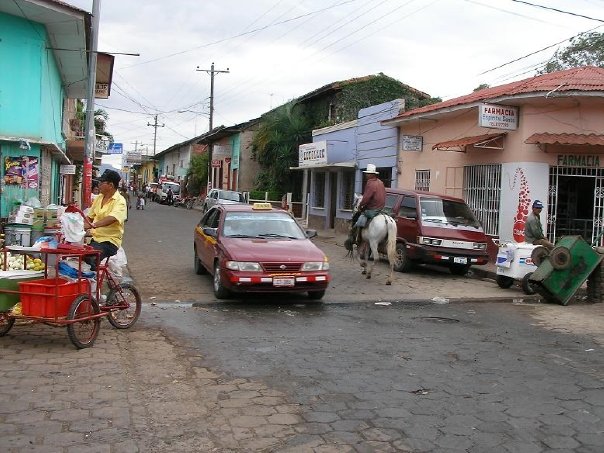
Kategorien in Santo Tomás
Branchen
Unternehmensverteilung nach Branche in Santo Tomás
| Branchenbeschreibung | Anzahl der Betriebe |
|---|---|
| Restaurants | 28 |
| Apotheken und Drogerien | 26 |
| Lebensmittelläden und Supermärkte | 21 |
| Kirchen | 19 |
| Bekleidungsladen | 19 |
| Einkaufen | 15 |
| Baumarkt | 12 |
| Cafés | 12 |
| Schönheitssalon | 12 |
| Herrenfriseure | 9 |
| Erziehung und Unterricht | 9 |
| Bars, Kneipen und Wirtshäuser | 8 |
| Handyläden | 7 |
| Auto-Teile | 7 |
Santo Tomás Facts
| Gebiet | 411.3 km² |
| Bevölkerung | 17.978 |
| Männliche Bevölkerung | 8.715 (48.5%) |
| Weibliche Bevölkerung | 9.263 (51.5%) |
| Population change (1975 to 2020) | +38.9% |
| Population change (2000 to 2020) | +4.3% |
| Mittleres Alter | 21.1 years (Male: 20.1, Female: 21.9) |
| BIP pro Kopf (KKP) | $4.735 (2022) |
| Zeit vor Ort | |
| Zeitzone | Nordamerikanische Zentral-Normalzeit |
| Geogr. Länge & Breite | 12.06938, -85.09059 |
Karte von Santo Tomás
Interaktive Karte
Bevölkerung von Santo Tomás
Jahre 1975 bis 2030
| Data | 1975 | 1990 | 2000 | 2015 | 2020 | 2025* | 2030* |
|---|---|---|---|---|---|---|---|
| Bevölkerung | 12.944 | 16.216 | 17.242 | 16.522 | 17.978 | 18.194 | 18.161 |
| Bevölkerungsdichte | 31,5 / km² | 39,4 / km² | 41,9 / km² | 40,2 / km² | 43,7 / km² | 44,2 / km² | 44,2 / km² |
Bevölkerungsänderung in Santo Tomás von 2000 bis 2020
Anstieg um 4.3 % von 2000 bis 2020
| Standort | Änderung seit 1975 | Änderung seit 1990 | Änderung seit 2000 |
|---|---|---|---|
| Santo Tomás | +38.9% | +10.9% | +4.3% |
| Departamento Chontales | — | — | — |
| Nicaragua | — | — | — |
Medianalter von Santo Tomás
Medianalter: 21.1 Jahre
| Standort | Mittleres Alter | Durchschnittsalter (weiblich) | Durchschnittsalter (männlich) |
|---|---|---|---|
| Santo Tomás | 21.1 yrs | 21.9 yrs | 20.1 yrs |
| Departamento Chontales | 20.9 yrs | 21.6 yrs | 20.1 yrs |
| Nicaragua | 20.4 yrs | 21.2 yrs | 19.7 yrs |
Bevölkerungsdichte von Santo Tomás
Bevölkerungsdichte: 43,7 / km²
| Standort | Bevölkerung | Gebiet | Dichte |
|---|---|---|---|
| Santo Tomás | 17.978 | 411,3 km² | 43,7 / km² |
| Departamento Chontales | 170.361 | 6.427,2 km² | 26,5 / km² |
| Nicaragua | 6,1 million | 128.508,4 km² | 47,1 / km² |
Historische und prognostizierte Bevölkerung von Santo Tomás
Geschätzte Bevölkerung von 0 bis 2100
- JRC (Gemeinsame Forschungsstelle der Europäischen Kommission) arbeitet an GHS built-up grid
- CIESIN (Center for International Earth Science Information Network)
- [Verknüpfung] Klein Goldewijk, K., Beusen, A., Doelman, J., and Stehfest, E.: Anthropogenic land use estimates for the Holocene – HYDE 3.2, Earth Syst. Sci. Data, 9, 927–953, https://doi.org/10.5194/essd-9-927-2017, 2017.
Price Distribution
Geschäftsverteilung nach Preis für Santo Tomás
Human Development Index (HDI)
Statistischer zusammengesetzter Index der Lebenserwartung, der Bildung und des Pro-Kopf-Einkommens.
Bruttoinlandsprodukt (BIP) von Santo Tomás
BIP pro Kopf, KKP (konstante internationale $ von 2017)
| Data | 1990 | 1995 | 2000 | 2005 | 2010 | 2015 | 2020 | 2022 |
|---|---|---|---|---|---|---|---|---|
| BIP pro Kopf | $3.782 | $3.340 | $1.839 | $3.719 | $4.639 | $6.400 | $5.746 | $4.735 |
| BIP insgesamt | $63,2 Mio. | $57,7 Mio. | $32,3 Mio. | $64,4 Mio. | $79,6 Mio. | $112,1 Mio. | $101,2 Mio. | $83,7 Mio. |
CO2-Emissionen von Santo Tomás
Kohlendioxid (CO2) -Emissionen pro Kopf in Tonnen pro Jahr
| Standort | CO2-Emissionen | CO2-Emissionen pro Kopf | Intensität der CO2-Emissionen |
|---|---|---|---|
| Santo Tomás | 17,718 tn | 0.99 tn | 43.1 tons/km² |
| Departamento Chontales | 167,656 tn | 0.98 tn | 26.1 tons/km² |
| Nicaragua | 5,658,022 tn | 0.93 tn | 44 tons/km² |
| CO2-Emissionen 2013 (Tonnen/Jahr) | 17,718 tn |
| CO2-Emissionen 2013 (Tonnen/Jahr) pro Kopf | 0.99 tn |
| CO2-Emissionsintensität 2013 (Tonnen/km²/Jahr) | 43.1 tons/km² |
Naturgefahrenrisiko
Relatives Risiko von 10
| Gefahr | Risikostufe |
|---|---|
| Dürre | Mittel (4.5) |
| Flut | Hoch (10) |
| Erdbeben | Mittel (6.5) |
| Zyklon | Mittel (5) |
| Erdrutsch | Mittel (7) |
* Das Risiko, insbesondere in Bezug auf Überschwemmungen oder Erdrutsche, gilt möglicherweise nicht für das gesamte Gebiet.
- Dilley, M., R.S. Chen, U. Deichmann, A.L. Lerner-Lam, M. Arnold, J. Agwe, P. Buys, O. Kjekstad, B. Lyon, and G. Yetman. 2005. Natural Disaster Hotspots: A Global Risk Analysis. Washington, D.C.: World Bank. https://doi.org/10.1596/0-8213-5930-4.
- Center for Hazards and Risk Research - CHRR - Columbia University, Center for International Earth Science Information Network - CIESIN - Columbia University, and Norwegian Geotechnical Institute - NGI. 2005. Global Landslide Hazard Distribution. Palisades, NY: NASA Socioeconomic Data and Applications Center (SEDAC). https://doi.org/10.7927/H4P848VZ.
- Center for Hazards and Risk Research - CHRR - Columbia University, Center for International Earth Science Information Network - CIESIN - Columbia University, International Bank for Reconstruction and Development - The World Bank, and United Nations Environment Programme Global Resource Information Database Geneva - UNEP/GRID-Geneva. 2005. Global Cyclone Hazard Frequency and Distribution. Palisades, NY: NASA Socioeconomic Data and Applications Center (SEDAC). https://doi.org/10.7927/H4CZ353K.
- Center for Hazards and Risk Research - CHRR - Columbia University, Center for International Earth Science Information Network - CIESIN - Columbia University, and International Research Institute for Climate and Society - IRI - Columbia University. 2005. Global Drought Hazard Frequency and Distribution. Palisades, NY: NASA Socioeconomic Data and Applications Center (SEDAC). https://doi.org/10.7927/H4VX0DFT.
- Center for Hazards and Risk Research - CHRR - Columbia University, Center for International Earth Science Information Network - CIESIN - Columbia University. 2005. Global Flood Hazard Frequency and Distribution. Palisades, NY: NASA Socioeconomic Data and Applications Center (SEDAC). https://doi.org/10.7927/H4668B3D.
- Center for Hazards and Risk Research - CHRR - Columbia University, Center for International Earth Science Information Network - CIESIN - Columbia University. 2005. Global Earthquake Hazard Distribution - Peak Ground Acceleration. Palisades, NY: NASA Socioeconomic Data and Applications Center (SEDAC). https://doi.org/10.7927/H4BZ63ZS.
Aktuelle Erdbeben in der Nähe
Magnitude 3.0 und höher
| Datum▼ | Zeit↕ | Magnitude↕ | Distance↕ | Tiefe↕ | Standort↕ | Verknüpfung |
|---|---|---|---|---|---|---|
| 7/3/19 | 10:20 PM | 4.3 | 93.8 km | 199,880 m | 6km S of Moyogalpa, Nicaragua | usgs.gov |
| 4/3/19 | 1:55 PM | 4.6 | 96.8 km | 190,840 m | 14km NNW of Cardenas, Nicaragua | usgs.gov |
| 1/31/19 | 3:13 AM | 4.4 | 86.2 km | 171,410 m | 18km SSE of Altagracia, Nicaragua | usgs.gov |
| 6/8/18 | 10:36 PM | 4.5 | 97.2 km | 187,180 m | 10km N of Cardenas, Nicaragua | usgs.gov |
| 5/26/16 | 1:02 AM | 5.2 | 93.6 km | 196,730 m | 5km SSW of Moyogalpa, Nicaragua | usgs.gov |
| 1/14/16 | 5:15 AM | 4.8 | 96.2 km | 190,170 m | 18km SSE of Moyogalpa, Nicaragua | usgs.gov |
| 10/7/14 | 4:28 AM | 5.1 | 93 km | 190,840 m | 4km SSW of Moyogalpa, Nicaragua | usgs.gov |
| 8/30/14 | 10:31 AM | 4.6 | 62.1 km | 5,280 m | 19km SW of Morrito, Nicaragua | usgs.gov |
| 8/5/14 | 4:11 AM | 4.6 | 92.5 km | 190,020 m | 20km NNW of Cardenas, Nicaragua | usgs.gov |
| 6/25/14 | 10:38 AM | 4.3 | 96.5 km | 188,460 m | 12km N of Cardenas, Nicaragua | usgs.gov |


Über unsere Daten
Die Daten auf dieser Seite werden anhand verschiedener öffentlich zugänglicher Werkzeuge und Quellen geschätzt. Sie werden ohne Gewähr bereitgestellt und können Ungenauigkeiten enthalten. Nutzung auf eigene Gefahr.