Kategorien in Tipitapa
Branchen
Unternehmensverteilung nach Branche in Tipitapa
| Branchenbeschreibung | Anzahl der Betriebe |
|---|---|
| Kirchen | 121 |
| Lebensmittelläden und Supermärkte | 96 |
| Restaurants | 83 |
| Einkaufen | 79 |
| Apotheken und Drogerien | 55 |
| Erziehung und Unterricht | 52 |
| Religion | 39 |
| Unternehmensleitung | 32 |
| Bekleidungsladen | 31 |
| Baumarkt | 28 |
| Bars, Kneipen und Wirtshäuser | 27 |
Tipitapa Facts
| Gebiet | 919.9 km² |
| Bevölkerung | 173.028 |
| Männliche Bevölkerung | 86.170 (49.8%) |
| Weibliche Bevölkerung | 86.858 (50.2%) |
| Population change (1975 to 2020) | +269.7% |
| Population change (2000 to 2020) | +76.7% |
| Mittleres Alter | 21.5 years (Male: 21.1, Female: 21.9) |
| BIP pro Kopf (KKP) | $6.472 (2022) |
| Vorwahlen | 253 |
| Stadtviertel | Orontes Centeno, El Trapiche, San Jorge, La Bocana, La Estrella |
| Zeit vor Ort | |
| Zeitzone | Nordamerikanische Zentral-Normalzeit |
| Geogr. Länge & Breite | 12.19732, -86.09706 |
Karte von Tipitapa
Interaktive Karte
Bevölkerung von Tipitapa
Jahre 1975 bis 2030
| Data | 1975 | 1990 | 2000 | 2015 | 2020 | 2025* | 2030* |
|---|---|---|---|---|---|---|---|
| Bevölkerung | 46.805 | 76.854 | 97.945 | 122.692 | 173.028 | 190.673 | 204.009 |
| Bevölkerungsdichte | 50,9 / km² | 83,5 / km² | 106,5 / km² | 133,4 / km² | 188,1 / km² | 207,3 / km² | 221,8 / km² |
Bevölkerungsänderung in Tipitapa von 2000 bis 2020
Anstieg um 76.7 % von 2000 bis 2020
| Standort | Änderung seit 1975 | Änderung seit 1990 | Änderung seit 2000 |
|---|---|---|---|
| Tipitapa | +269.7% | +125.1% | +76.7% |
| Departamento Managua | — | — | — |
| Nicaragua | — | — | — |
Medianalter von Tipitapa
Medianalter: 21.5 Jahre
| Standort | Mittleres Alter | Durchschnittsalter (weiblich) | Durchschnittsalter (männlich) |
|---|---|---|---|
| Tipitapa | 21.5 yrs | 21.9 yrs | 21.1 yrs |
| Departamento Managua | 22.9 yrs | 23.8 yrs | 21.9 yrs |
| Nicaragua | 20.4 yrs | 21.2 yrs | 19.7 yrs |
Bevölkerungsdichte von Tipitapa
Bevölkerungsdichte: 188 / km²
| Standort | Bevölkerung | Gebiet | Dichte |
|---|---|---|---|
| Tipitapa | 173.028 | 919,9 km² | 188 / km² |
| Departamento Managua | 1,4 million | 3.487,2 km² | 403 / km² |
| Nicaragua | 6,1 million | 128.508,4 km² | 47,1 / km² |
Historische und prognostizierte Bevölkerung von Tipitapa
Geschätzte Bevölkerung von 0 bis 2100
- JRC (Gemeinsame Forschungsstelle der Europäischen Kommission) arbeitet an GHS built-up grid
- CIESIN (Center for International Earth Science Information Network)
- [Verknüpfung] Klein Goldewijk, K., Beusen, A., Doelman, J., and Stehfest, E.: Anthropogenic land use estimates for the Holocene – HYDE 3.2, Earth Syst. Sci. Data, 9, 927–953, https://doi.org/10.5194/essd-9-927-2017, 2017.
Stadtteile in Tipitapa
Prozentsatz der Unternehmen nach Stadtteil in Tipitapa
Price Distribution
Geschäftsverteilung nach Preis für Tipitapa
Human Development Index (HDI)
Statistischer zusammengesetzter Index der Lebenserwartung, der Bildung und des Pro-Kopf-Einkommens.
Bruttoinlandsprodukt (BIP) von Tipitapa
BIP pro Kopf, KKP (konstante internationale $ von 2017)
| Data | 1990 | 1995 | 2000 | 2005 | 2010 | 2015 | 2020 | 2022 |
|---|---|---|---|---|---|---|---|---|
| BIP pro Kopf | $4.116 | $5.693 | $5.049 | $5.288 | $5.458 | $6.405 | $6.056 | $6.472 |
| BIP insgesamt | $193,8 Mio. | $327,9 Mio. | $394,9 Mio. | $459,2 Mio. | $550,2 Mio. | $741 Mio. | $855,3 Mio. | $928,5 Mio. |
CO2-Emissionen von Tipitapa
Kohlendioxid (CO2) -Emissionen pro Kopf in Tonnen pro Jahr
| Standort | CO2-Emissionen | CO2-Emissionen pro Kopf | Intensität der CO2-Emissionen |
|---|---|---|---|
| Tipitapa | 212,602 tn | 1.23 tn | 231.1 tons/km² |
| Departamento Managua | 1,728,254 tn | 1.23 tn | 495.6 tons/km² |
| Nicaragua | 5,658,022 tn | 0.93 tn | 44 tons/km² |
| CO2-Emissionen 2013 (Tonnen/Jahr) | 212,602 tn |
| CO2-Emissionen 2013 (Tonnen/Jahr) pro Kopf | 1.23 tn |
| CO2-Emissionsintensität 2013 (Tonnen/km²/Jahr) | 231.1 tons/km² |
Naturgefahrenrisiko
Relatives Risiko von 10
| Gefahr | Risikostufe |
|---|---|
| Dürre | Hoch (8) |
| Flut | Hoch (8) |
| Erdbeben | Hoch (7.6) |
| Erdrutsch | Mittel (7) |
* Das Risiko, insbesondere in Bezug auf Überschwemmungen oder Erdrutsche, gilt möglicherweise nicht für das gesamte Gebiet.
- Dilley, M., R.S. Chen, U. Deichmann, A.L. Lerner-Lam, M. Arnold, J. Agwe, P. Buys, O. Kjekstad, B. Lyon, and G. Yetman. 2005. Natural Disaster Hotspots: A Global Risk Analysis. Washington, D.C.: World Bank. https://doi.org/10.1596/0-8213-5930-4.
- Center for Hazards and Risk Research - CHRR - Columbia University, Center for International Earth Science Information Network - CIESIN - Columbia University, and Norwegian Geotechnical Institute - NGI. 2005. Global Landslide Hazard Distribution. Palisades, NY: NASA Socioeconomic Data and Applications Center (SEDAC). https://doi.org/10.7927/H4P848VZ.
- Center for Hazards and Risk Research - CHRR - Columbia University, Center for International Earth Science Information Network - CIESIN - Columbia University, and International Research Institute for Climate and Society - IRI - Columbia University. 2005. Global Drought Hazard Frequency and Distribution. Palisades, NY: NASA Socioeconomic Data and Applications Center (SEDAC). https://doi.org/10.7927/H4VX0DFT.
- Center for Hazards and Risk Research - CHRR - Columbia University, Center for International Earth Science Information Network - CIESIN - Columbia University. 2005. Global Flood Hazard Frequency and Distribution. Palisades, NY: NASA Socioeconomic Data and Applications Center (SEDAC). https://doi.org/10.7927/H4668B3D.
- Center for Hazards and Risk Research - CHRR - Columbia University, Center for International Earth Science Information Network - CIESIN - Columbia University. 2005. Global Earthquake Hazard Distribution - Peak Ground Acceleration. Palisades, NY: NASA Socioeconomic Data and Applications Center (SEDAC). https://doi.org/10.7927/H4BZ63ZS.
Aktuelle Erdbeben in der Nähe
Magnitude 3.0 und höher
| Datum▼ | Zeit↕ | Magnitude↕ | Distance↕ | Tiefe↕ | Standort↕ | Verknüpfung |
|---|---|---|---|---|---|---|
| 3/12/18 | 6:44 AM | 4.6 | 39.8 km | 164,720 m | 0km NW of Jinotepe, Nicaragua | usgs.gov |
| 8/28/17 | 9:40 PM | 4.2 | 31.2 km | 146,360 m | 2km E of El Crucero, Nicaragua | usgs.gov |
| 6/22/16 | 5:24 AM | 4.5 | 32.3 km | 193,030 m | 6km SW of Ciudad Sandino, Nicaragua | usgs.gov |
| 5/31/16 | 10:00 PM | 3.7 | 16.9 km | 10,000 m | 4km SE of Managua, Nicaragua | usgs.gov |
| 4/17/16 | 8:21 PM | 4.2 | 36.4 km | 138,180 m | 10km SW of Ciudad Sandino, Nicaragua | usgs.gov |
| 2/9/16 | 7:00 PM | 3.8 | 24.3 km | 16,880 m | 2km WSW of Ticuantepe, Nicaragua | usgs.gov |
| 11/25/15 | 12:19 AM | 4.7 | 39.1 km | 9,830 m | 17km ENE of Nagarote, Nicaragua | usgs.gov |
| 5/10/15 | 4:27 AM | 3.3 | 29.2 km | 5,000 m | 3km NW of La Concepcion, Nicaragua | usgs.gov |
| 11/10/14 | 12:46 PM | 4.7 | 34.1 km | 193,740 m | 9km SSW of Ciudad Sandino, Nicaragua | usgs.gov |
| 5/1/14 | 1:25 PM | 4.8 | 38.8 km | 9,270 m | 2km SE of Valle San Francisco, Nicaragua | usgs.gov |
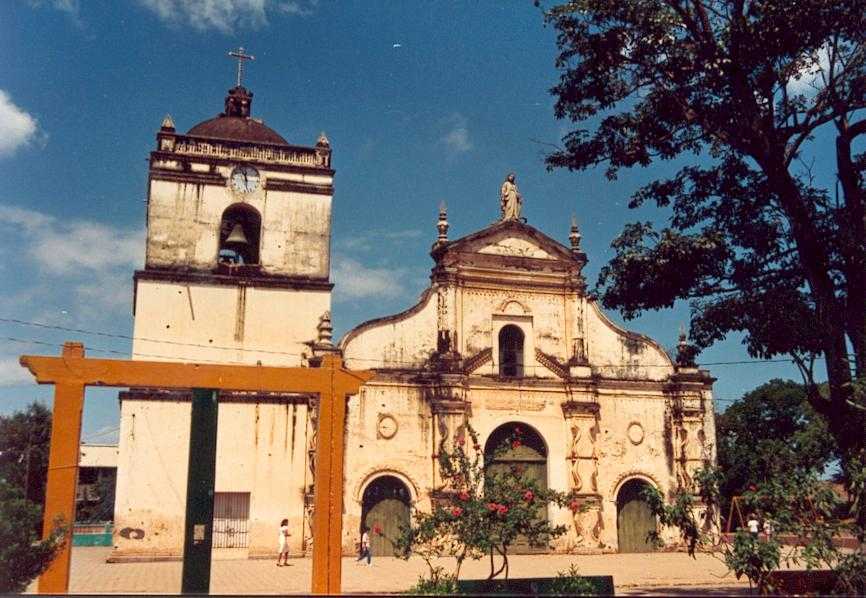
Tipitapa
Tipitapa ist ein Municipio im Departamento Managua in Nicaragua. liegt verkehrsgünstig an der Panamericana 22 km östlich von Managua und Minuten vom Internationalen Flughafen Managua am Managuasee.
Tipitapa Wikipedia-Seite


Über unsere Daten
Die Daten auf dieser Seite werden anhand verschiedener öffentlich zugänglicher Werkzeuge und Quellen geschätzt. Sie werden ohne Gewähr bereitgestellt und können Ungenauigkeiten enthalten. Nutzung auf eigene Gefahr.