Rangitukia Facts
| Gebiet | 169.2 km² |
| Bevölkerung | 505 |
| Männliche Bevölkerung | 275 (54.5%) |
| Weibliche Bevölkerung | 230 (45.5%) |
| Population change (1975 to 2020) | +10.0% |
| Population change (2000 to 2020) | +8.6% |
| Mittleres Alter | 36.8 years (Male: 35.7, Female: 38) |
| BIP pro Kopf (KKP) | $32.165 (2022) |
| Zeit vor Ort | |
| Zeitzone | Neuseeland-Normalzeit |
| Geogr. Länge & Breite | -37.76667, 178.45000 |
| Postleitzahlen | 4049 |
Karte von Rangitukia
Interaktive Karte
Bevölkerung von Rangitukia
Jahre 1975 bis 2030
| Data | 1975 | 1990 | 2000 | 2015 | 2020 | 2025* | 2030* |
|---|---|---|---|---|---|---|---|
| Bevölkerung | 459 | 449 | 465 | 471 | 505 | 506 | 501 |
| Bevölkerungsdichte | 2,7 / km² | 2,7 / km² | 2,7 / km² | 2,8 / km² | 3 / km² | 3 / km² | 3 / km² |
Bevölkerungsänderung in Rangitukia von 2000 bis 2020
Anstieg um 8.6 % von 2000 bis 2020
| Standort | Änderung seit 1975 | Änderung seit 1990 | Änderung seit 2000 |
|---|---|---|---|
| Rangitukia | +10% | +12.5% | +8.6% |
| Gisborne | — | — | — |
| Neuseeland | — | — | — |
Medianalter von Rangitukia
Medianalter: 36.8 Jahre
| Standort | Mittleres Alter | Durchschnittsalter (weiblich) | Durchschnittsalter (männlich) |
|---|---|---|---|
| Rangitukia | 36.8 yrs | 38 yrs | 35.7 yrs |
| Gisborne | 36.9 yrs | 38 yrs | 35.7 yrs |
| Neuseeland | 37.9 yrs | 38.9 yrs | 36.9 yrs |
Bevölkerungsdichte von Rangitukia
Bevölkerungsdichte: 3 / km²
| Standort | Bevölkerung | Gebiet | Dichte |
|---|---|---|---|
| Rangitukia | 505 | 169,2 km² | 3 / km² |
| Gisborne | 45.621 | 13.931,4 km² | 3,3 / km² |
| Neuseeland | 4,4 million | 270.103,3 km² | 16,3 / km² |
Historische und prognostizierte Bevölkerung von Rangitukia
Geschätzte Bevölkerung von 1500 bis 2100
- JRC (Gemeinsame Forschungsstelle der Europäischen Kommission) arbeitet an GHS built-up grid
- CIESIN (Center for International Earth Science Information Network)
- [Verknüpfung] Klein Goldewijk, K., Beusen, A., Doelman, J., and Stehfest, E.: Anthropogenic land use estimates for the Holocene – HYDE 3.2, Earth Syst. Sci. Data, 9, 927–953, https://doi.org/10.5194/essd-9-927-2017, 2017.
Human Development Index (HDI)
Statistischer zusammengesetzter Index der Lebenserwartung, der Bildung und des Pro-Kopf-Einkommens.
Bruttoinlandsprodukt (BIP) von Rangitukia
BIP pro Kopf, KKP (konstante internationale $ von 2017)
| Data | 1990 | 1995 | 2000 | 2005 | 2010 | 2015 | 2020 | 2022 |
|---|---|---|---|---|---|---|---|---|
| BIP pro Kopf | $20.323 | $21.479 | $23.568 | $25.275 | $26.300 | $27.795 | $29.954 | $32.165 |
| BIP insgesamt | $1,8 Mio. | $1,9 Mio. | $2,1 Mio. | $2,3 Mio. | $2,4 Mio. | $2,5 Mio. | $2,8 Mio. | $3 Mio. |
CO2-Emissionen von Rangitukia
Kohlendioxid (CO2) -Emissionen pro Kopf in Tonnen pro Jahr
| Standort | CO2-Emissionen | CO2-Emissionen pro Kopf | Intensität der CO2-Emissionen |
|---|---|---|---|
| Rangitukia | 4,213 tn | 8.34 tn | 24.9 tons/km² |
| Gisborne | 234,193 tn | 5.13 tn | 16.8 tons/km² |
| Neuseeland | 37,929,206 tn | 8.61 tn | 140.4 tons/km² |
| CO2-Emissionen 2013 (Tonnen/Jahr) | 4,213 tn |
| CO2-Emissionen 2013 (Tonnen/Jahr) pro Kopf | 8.34 tn |
| CO2-Emissionsintensität 2013 (Tonnen/km²/Jahr) | 24.9 tons/km² |
Naturgefahrenrisiko
Relatives Risiko von 10
| Gefahr | Risikostufe |
|---|---|
| Erdbeben | Hoch (9.1) |
| Erdrutsch | Mittel (7) |
* Das Risiko, insbesondere in Bezug auf Überschwemmungen oder Erdrutsche, gilt möglicherweise nicht für das gesamte Gebiet.
- Dilley, M., R.S. Chen, U. Deichmann, A.L. Lerner-Lam, M. Arnold, J. Agwe, P. Buys, O. Kjekstad, B. Lyon, and G. Yetman. 2005. Natural Disaster Hotspots: A Global Risk Analysis. Washington, D.C.: World Bank. https://doi.org/10.1596/0-8213-5930-4.
- Center for Hazards and Risk Research - CHRR - Columbia University, Center for International Earth Science Information Network - CIESIN - Columbia University, and Norwegian Geotechnical Institute - NGI. 2005. Global Landslide Hazard Distribution. Palisades, NY: NASA Socioeconomic Data and Applications Center (SEDAC). https://doi.org/10.7927/H4P848VZ.
- Center for Hazards and Risk Research - CHRR - Columbia University, Center for International Earth Science Information Network - CIESIN - Columbia University. 2005. Global Earthquake Hazard Distribution - Peak Ground Acceleration. Palisades, NY: NASA Socioeconomic Data and Applications Center (SEDAC). https://doi.org/10.7927/H4BZ63ZS.
Aktuelle Erdbeben in der Nähe
Magnitude 3.0 und höher
| Datum▼ | Zeit↕ | Magnitude↕ | Distance↕ | Tiefe↕ | Standort↕ | Verknüpfung |
|---|---|---|---|---|---|---|
| 10/10/16 | 6:01 AM | 4.2 | 17.3 km | 39,400 m | 117km NNE of Gisborne, New Zealand | usgs.gov |
| 9/23/16 | 6:20 AM | 4.2 | 24.5 km | 10,000 m | 102km NE of Gisborne, New Zealand | usgs.gov |
| 9/3/16 | 11:53 AM | 4.6 | 31.3 km | 25,660 m | 135km NNE of Gisborne, New Zealand | usgs.gov |
| 4/13/15 | 11:05 PM | 4.4 | 37.2 km | 13,330 m | 87km NE of Gisborne, New Zealand | usgs.gov |
| 11/8/11 | 5:14 PM | 4.8 | 39.9 km | 50,900 m | off the east coast of the North Island of New Zealand | usgs.gov |
| 5/9/09 | 7:59 AM | 4.2 | 6.1 km | 56,700 m | off the east coast of the North Island of New Zealand | usgs.gov |
| 2/17/09 | 4:14 AM | 4.2 | 15.5 km | 57,500 m | off the east coast of the North Island of New Zealand | usgs.gov |
| 12/11/08 | 11:17 PM | 3.8 | 20.3 km | 12,000 m | off the east coast of the North Island of New Zealand | usgs.gov |
| 9/18/08 | 10:27 PM | 3.9 | 29.1 km | 20,500 m | off the east coast of the North Island of New Zealand | usgs.gov |
| 3/26/08 | 9:29 PM | 4 | 25.5 km | 51,000 m | off the east coast of the North Island of New Zealand | usgs.gov |
Rangitukia
ist eine kleine Gemeinde in der Region Gisborne im Nordosten der Nordinsel Neuseelands. Sie liegt an der Nordseite der Mündung des Waiapu River. Der Ort liegt 155 km nördlich der Stadt Gisborne. Der kleine Fluss Maraehara River mündet im Ortsbereich in den W..
Rangitukia Wikipedia-Seite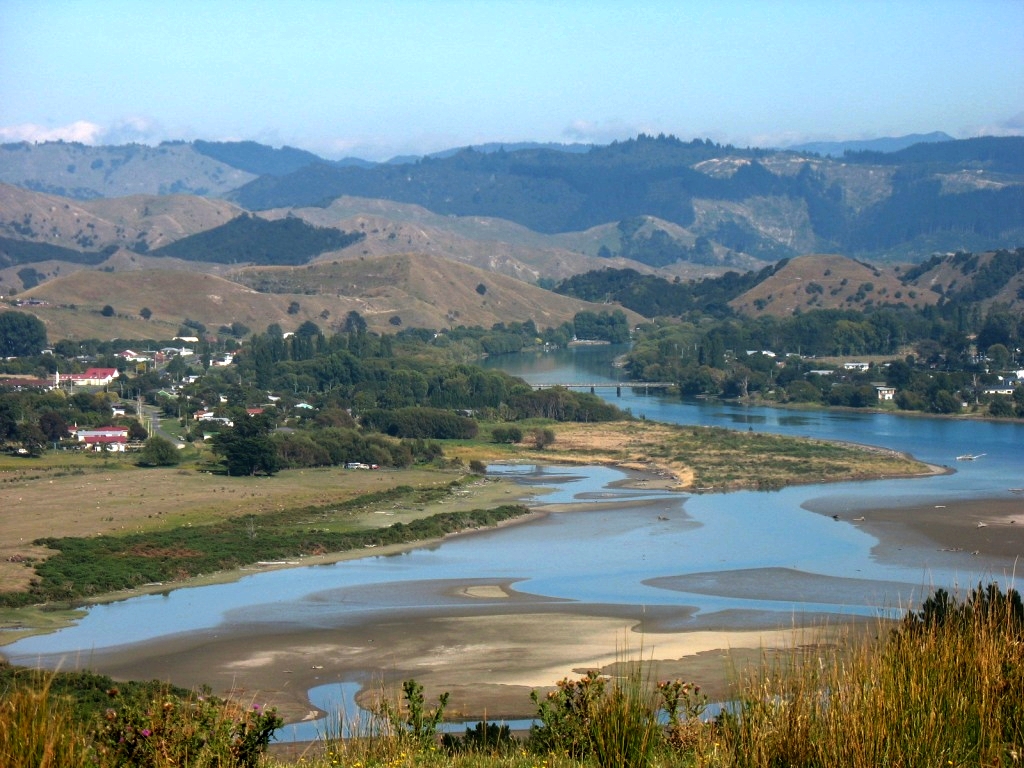


Über unsere Daten
Die Daten auf dieser Seite werden anhand verschiedener öffentlich zugänglicher Werkzeuge und Quellen geschätzt. Sie werden ohne Gewähr bereitgestellt und können Ungenauigkeiten enthalten. Nutzung auf eigene Gefahr.