Kategorien in Buhi
Branchen
Unternehmensverteilung nach Branche in Buhi
| Branchenbeschreibung | Anzahl der Betriebe |
|---|---|
| Erziehung und Unterricht | 48 |
| Kirchen | 31 |
| Restaurants | 30 |
| Religion | 19 |
| Einkaufen | 18 |
| Öffentliche Verwaltung | 14 |
| Reisebüros | 12 |
| Reise und Transport | 9 |
| Öffentliche Parkanlagen | 9 |
| Sonstige Beherbergungsstätten | 9 |
Buhi Facts
| Gebiet | 203.3 km² |
| Bevölkerung | 117.408 |
| Männliche Bevölkerung | 59.584 (50.7%) |
| Weibliche Bevölkerung | 57.824 (49.3%) |
| Population change (1975 to 2020) | +469.9% |
| Population change (2000 to 2020) | +56.4% |
| Mittleres Alter | 21.1 years (Male: 20.7, Female: 21.7) |
| BIP pro Kopf (KKP) | $3.862 (2022) |
| Vorwahlen | 54 |
| Stadtviertel | San Pedro, San Buena, San Pascual, San Jose Baybayon, Balong-Bato |
| Zeit vor Ort | |
| Zeitzone | Philippinische Normalzeit |
| Geogr. Länge & Breite | 13.43220, 123.51700 |
| Postleitzahlen | 4433 |
Karte von Buhi
Interaktive Karte
Bevölkerung von Buhi
Jahre 1975 bis 2030
| Data | 1975 | 1990 | 2000 | 2015 | 2020 | 2025* | 2030* |
|---|---|---|---|---|---|---|---|
| Bevölkerung | 20.602 | 53.387 | 75.077 | 100.883 | 117.408 | 129.877 | 141.160 |
| Bevölkerungsdichte | 101,4 / km² | 262,7 / km² | 369,4 / km² | 496,3 / km² | 577,7 / km² | 639 / km² | 694,5 / km² |
Bevölkerungsänderung in Buhi von 2000 bis 2020
Anstieg um 56.4 % von 2000 bis 2020
| Standort | Änderung seit 1975 | Änderung seit 1990 | Änderung seit 2000 |
|---|---|---|---|
| Buhi | +469.9% | +119.9% | +56.4% |
| Philippinen | — | — | — |
Medianalter von Buhi
Medianalter: 21.1 Jahre
| Standort | Mittleres Alter | Durchschnittsalter (weiblich) | Durchschnittsalter (männlich) |
|---|---|---|---|
| Buhi | 21.1 yrs | 21.7 yrs | 20.7 yrs |
| Philippinen | 23.2 yrs | 23.6 yrs | 22.8 yrs |
Bevölkerungsdichte von Buhi
Bevölkerungsdichte: 578 / km²
| Standort | Bevölkerung | Gebiet | Dichte |
|---|---|---|---|
| Buhi | 117.408 | 203,3 km² | 578 / km² |
| Philippinen | 96,6 million | 296.939,4 km² | 325 / km² |
Historische und prognostizierte Bevölkerung von Buhi
Geschätzte Bevölkerung von 1860 bis 2100
- JRC (Gemeinsame Forschungsstelle der Europäischen Kommission) arbeitet an GHS built-up grid
- CIESIN (Center for International Earth Science Information Network)
- [Verknüpfung] Klein Goldewijk, K., Beusen, A., Doelman, J., and Stehfest, E.: Anthropogenic land use estimates for the Holocene – HYDE 3.2, Earth Syst. Sci. Data, 9, 927–953, https://doi.org/10.5194/essd-9-927-2017, 2017.
Stadtteile in Buhi
Prozentsatz der Unternehmen nach Stadtteil in Buhi
Vorwahlen
Prozentuale Vorwahlen, die von Unternehmen in Buhi verwendet werden
Postleitzahlen
Prozentsatz der Unternehmen nach Postleitzahl in Buhi
Price Distribution
Geschäftsverteilung nach Preis für Buhi
Human Development Index (HDI)
Statistischer zusammengesetzter Index der Lebenserwartung, der Bildung und des Pro-Kopf-Einkommens.
Bruttoinlandsprodukt (BIP) von Buhi
BIP pro Kopf, KKP (konstante internationale $ von 2017)
| Data | 1990 | 1995 | 2000 | 2005 | 2010 | 2015 | 2020 | 2022 |
|---|---|---|---|---|---|---|---|---|
| BIP pro Kopf | $2.287 | $2.648 | $3.039 | $3.211 | $2.889 | $2.995 | $3.776 | $3.862 |
| BIP insgesamt | $43,1 Mio. | $59,3 Mio. | $82 Mio. | $101,3 Mio. | $101 Mio. | $118,5 Mio. | $165 Mio. | $178,7 Mio. |
CO2-Emissionen von Buhi
Kohlendioxid (CO2) -Emissionen pro Kopf in Tonnen pro Jahr
| Standort | CO2-Emissionen | CO2-Emissionen pro Kopf | Intensität der CO2-Emissionen |
|---|---|---|---|
| Buhi | 129,950 tn | 1.11 tn | 639.4 tons/km² |
| Philippinen | 104,920,564 tn | 1.09 tn | 353.3 tons/km² |
| CO2-Emissionen 2013 (Tonnen/Jahr) | 129,950 tn |
| CO2-Emissionen 2013 (Tonnen/Jahr) pro Kopf | 1.11 tn |
| CO2-Emissionsintensität 2013 (Tonnen/km²/Jahr) | 639.4 tons/km² |
Naturgefahrenrisiko
Relatives Risiko von 10
| Gefahr | Risikostufe |
|---|---|
| Dürre | Mittel (5) |
| Flut | Mittel (7) |
| Erdbeben | Hoch (8) |
| Zyklon | Hoch (10) |
| Erdrutsch | Hoch (10) |
| Vulkan | Hoch (10) |
* Das Risiko, insbesondere in Bezug auf Überschwemmungen oder Erdrutsche, gilt möglicherweise nicht für das gesamte Gebiet.
- Dilley, M., R.S. Chen, U. Deichmann, A.L. Lerner-Lam, M. Arnold, J. Agwe, P. Buys, O. Kjekstad, B. Lyon, and G. Yetman. 2005. Natural Disaster Hotspots: A Global Risk Analysis. Washington, D.C.: World Bank. https://doi.org/10.1596/0-8213-5930-4.
- Center for Hazards and Risk Research - CHRR - Columbia University, Center for International Earth Science Information Network - CIESIN - Columbia University, and Norwegian Geotechnical Institute - NGI. 2005. Global Landslide Hazard Distribution. Palisades, NY: NASA Socioeconomic Data and Applications Center (SEDAC). https://doi.org/10.7927/H4P848VZ.
- Center for Hazards and Risk Research - CHRR - Columbia University, Center for International Earth Science Information Network - CIESIN - Columbia University, International Bank for Reconstruction and Development - The World Bank, and United Nations Environment Programme Global Resource Information Database Geneva - UNEP/GRID-Geneva. 2005. Global Cyclone Hazard Frequency and Distribution. Palisades, NY: NASA Socioeconomic Data and Applications Center (SEDAC). https://doi.org/10.7927/H4CZ353K.
- Center for Hazards and Risk Research - CHRR - Columbia University, Center for International Earth Science Information Network - CIESIN - Columbia University, and International Research Institute for Climate and Society - IRI - Columbia University. 2005. Global Drought Hazard Frequency and Distribution. Palisades, NY: NASA Socioeconomic Data and Applications Center (SEDAC). https://doi.org/10.7927/H4VX0DFT.
- Center for Hazards and Risk Research - CHRR - Columbia University, Center for International Earth Science Information Network - CIESIN - Columbia University. 2005. Global Flood Hazard Frequency and Distribution. Palisades, NY: NASA Socioeconomic Data and Applications Center (SEDAC). https://doi.org/10.7927/H4668B3D.
- Center for Hazards and Risk Research - CHRR - Columbia University, Center for International Earth Science Information Network - CIESIN - Columbia University. 2005. Global Volcano Hazard Frequency and Distribution. Palisades, NY: NASA Socioeconomic Data and Applications Center (SEDAC). https://doi.org/10.7927/H4BR8Q45.
- Center for Hazards and Risk Research - CHRR - Columbia University, Center for International Earth Science Information Network - CIESIN - Columbia University. 2005. Global Earthquake Hazard Distribution - Peak Ground Acceleration. Palisades, NY: NASA Socioeconomic Data and Applications Center (SEDAC). https://doi.org/10.7927/H4BZ63ZS.
Aktuelle Erdbeben in der Nähe
Magnitude 3.0 und höher
| Datum▼ | Zeit↕ | Magnitude↕ | Distance↕ | Tiefe↕ | Standort↕ | Verknüpfung |
|---|---|---|---|---|---|---|
| 5/14/19 | 1:36 AM | 4.3 | 76.8 km | 35,000 m | 13km NW of Monreal, Philippines | usgs.gov |
| 3/19/19 | 2:59 AM | 4.2 | 79.8 km | 113,590 m | 2km N of Casiguran, Philippines | usgs.gov |
| 12/6/18 | 9:26 AM | 4.2 | 72.4 km | 64,430 m | 1km NE of Sorsogon, Philippines | usgs.gov |
| 11/5/17 | 3:36 PM | 4.6 | 48.5 km | 54,840 m | 4km E of Maslog, Philippines | usgs.gov |
| 9/21/17 | 3:39 AM | 4.5 | 72.5 km | 36,420 m | 6km ESE of Mabiton, Philippines | usgs.gov |
| 7/30/17 | 3:31 PM | 4.4 | 68.9 km | 76,320 m | 1km SSE of Capuy, Philippines | usgs.gov |
| 1/11/17 | 6:24 AM | 4.8 | 64.5 km | 75,030 m | 17km S of Calolbon, Philippines | usgs.gov |
| 1/13/16 | 8:46 PM | 4.2 | 43 km | 35,000 m | 5km NNE of Cagmanaba, Philippines | usgs.gov |
| 5/13/15 | 5:00 PM | 4.5 | 72.8 km | 56,900 m | 8km NE of Bacon, Philippines | usgs.gov |
| 3/16/15 | 12:09 AM | 4.4 | 47.2 km | 35,000 m | 3km WSW of Pio Duran, Philippines | usgs.gov |
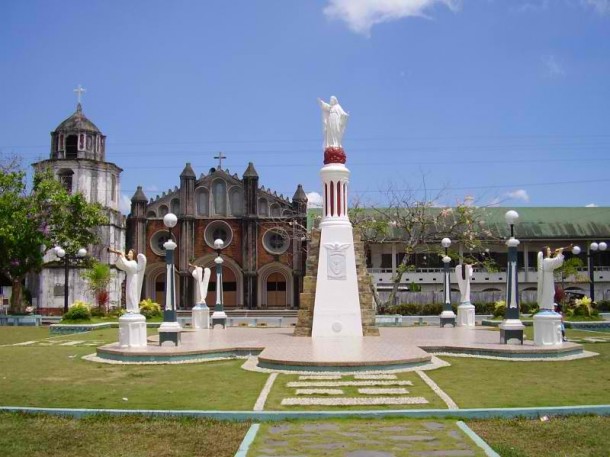
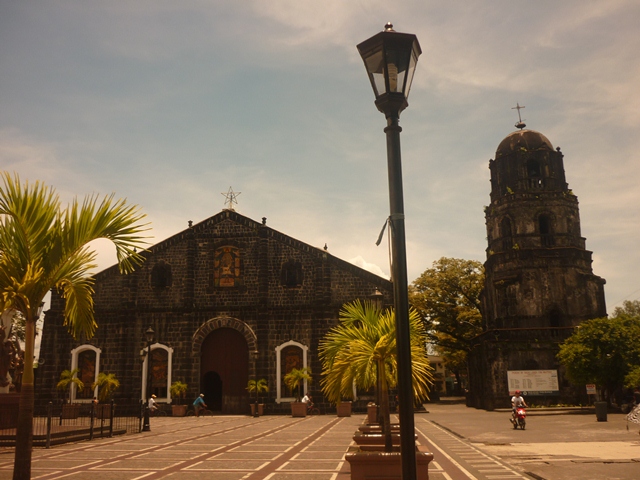
Buhi
Buhi ist eine philippinische Stadtgemeinde. Sie liegt im südöstlichen Teil der Insel Luzón in der Bicol-Region in der Provinz Camarines Sur etwa 290 km südöstlich von Manila. grenzt im Westen an Iriga City, im Norden an die Stadtgemeinde von Sagñay, im Süden ..
Buhi Wikipedia-Seite

Über unsere Daten
Die Daten auf dieser Seite werden anhand verschiedener öffentlich zugänglicher Werkzeuge und Quellen geschätzt. Sie werden ohne Gewähr bereitgestellt und können Ungenauigkeiten enthalten. Nutzung auf eigene Gefahr.