Kategorien in Consolacion
Branchen
Unternehmensverteilung nach Branche in Consolacion
| Branchenbeschreibung | Anzahl der Betriebe |
|---|---|
| Einkaufen | 414 |
| Restaurants | 360 |
| Reise und Transport | 176 |
| Wohnungen | 150 |
| Alle Lebensmittel und Getränke | 116 |
| Shopping Sonstige | 112 |
| Lebensmittelläden und Supermärkte | 88 |
| Cafés | 80 |
| Bekleidungsladen | 79 |
Consolacion Facts
| Gebiet | 34.6 km² |
| Bevölkerung | 217.933 |
| Männliche Bevölkerung | 108.852 (49.9%) |
| Weibliche Bevölkerung | 109.081 (50.1%) |
| Population change (1975 to 2020) | +1410.4% |
| Population change (2000 to 2020) | +138.5% |
| Mittleres Alter | 23.9 years (Male: 23.6, Female: 24.1) |
| BIP pro Kopf (KKP) | $6.413 (2022) |
| Stadtviertel | Lamac, Cansaga, Tayud, Pitogo, Poblacion Oriental |
| Zeit vor Ort | |
| Zeitzone | Philippinische Normalzeit |
| Geogr. Länge & Breite | 10.37660, 123.95730 |
Karte von Consolacion
Interaktive Karte
Bevölkerung von Consolacion
Jahre 1975 bis 2030
| Data | 1975 | 1990 | 2000 | 2015 | 2020 | 2025* | 2030* |
|---|---|---|---|---|---|---|---|
| Bevölkerung | 14.429 | 49.394 | 91.368 | 198.955 | 217.933 | 240.178 | 262.066 |
| Bevölkerungsdichte | 416,7 / km² | 1.426,5 / km² | 2.638,8 / km² | 5.746 / km² | 6.294,1 / km² | 6.936,5 / km² | 7.568,7 / km² |
Bevölkerungsänderung in Consolacion von 2000 bis 2020
Anstieg um 138.5 % von 2000 bis 2020
| Standort | Änderung seit 1975 | Änderung seit 1990 | Änderung seit 2000 |
|---|---|---|---|
| Consolacion | +1410.4% | +341.2% | +138.5% |
| Philippinen | — | — | — |
Medianalter von Consolacion
Medianalter: 23.9 Jahre
| Standort | Mittleres Alter | Durchschnittsalter (weiblich) | Durchschnittsalter (männlich) |
|---|---|---|---|
| Consolacion | 23.9 yrs | 24.1 yrs | 23.6 yrs |
| Philippinen | 23.2 yrs | 23.6 yrs | 22.8 yrs |
Bevölkerungsdichte von Consolacion
Bevölkerungsdichte: 6.294 / km²
| Standort | Bevölkerung | Gebiet | Dichte |
|---|---|---|---|
| Consolacion | 217.933 | 34,6 km² | 6.294 / km² |
| Philippinen | 96,6 million | 296.939,4 km² | 325 / km² |
Historische und prognostizierte Bevölkerung von Consolacion
Geschätzte Bevölkerung von 1940 bis 2100
- JRC (Gemeinsame Forschungsstelle der Europäischen Kommission) arbeitet an GHS built-up grid
- CIESIN (Center for International Earth Science Information Network)
- [Verknüpfung] Klein Goldewijk, K., Beusen, A., Doelman, J., and Stehfest, E.: Anthropogenic land use estimates for the Holocene – HYDE 3.2, Earth Syst. Sci. Data, 9, 927–953, https://doi.org/10.5194/essd-9-927-2017, 2017.
Stadtteile in Consolacion
Prozentsatz der Unternehmen nach Stadtteil in Consolacion
Vorwahlen
Prozentuale Vorwahlen, die von Unternehmen in Consolacion verwendet werden
Price Distribution
Geschäftsverteilung nach Preis für Consolacion
Human Development Index (HDI)
Statistischer zusammengesetzter Index der Lebenserwartung, der Bildung und des Pro-Kopf-Einkommens.
Bruttoinlandsprodukt (BIP) von Consolacion
BIP pro Kopf, KKP (konstante internationale $ von 2017)
| Data | 1990 | 1995 | 2000 | 2005 | 2010 | 2015 | 2020 | 2022 |
|---|---|---|---|---|---|---|---|---|
| BIP pro Kopf | $5.101 | $5.614 | $5.982 | $6.798 | $6.583 | $6.333 | $6.038 | $6.413 |
| BIP insgesamt | $80,4 Mio. | $103,2 Mio. | $131,2 Mio. | $176,8 Mio. | $200,7 Mio. | $221,4 Mio. | $236,6 Mio. | $261,7 Mio. |
CO2-Emissionen von Consolacion
Kohlendioxid (CO2) -Emissionen pro Kopf in Tonnen pro Jahr
| Standort | CO2-Emissionen | CO2-Emissionen pro Kopf | Intensität der CO2-Emissionen |
|---|---|---|---|
| Consolacion | 256,152 tn | 1.18 tn | 7,397.9 tons/km² |
| Philippinen | 104,920,564 tn | 1.09 tn | 353.3 tons/km² |
| CO2-Emissionen 2013 (Tonnen/Jahr) | 256,152 tn |
| CO2-Emissionen 2013 (Tonnen/Jahr) pro Kopf | 1.18 tn |
| CO2-Emissionsintensität 2013 (Tonnen/km²/Jahr) | 7,397.9 tons/km² |
Naturgefahrenrisiko
Relatives Risiko von 10
| Gefahr | Risikostufe |
|---|---|
| Dürre | Mittel (5) |
| Flut | Hoch (10) |
| Erdbeben | Mittel (7) |
| Zyklon | Hoch (10) |
* Das Risiko, insbesondere in Bezug auf Überschwemmungen oder Erdrutsche, gilt möglicherweise nicht für das gesamte Gebiet.
- Dilley, M., R.S. Chen, U. Deichmann, A.L. Lerner-Lam, M. Arnold, J. Agwe, P. Buys, O. Kjekstad, B. Lyon, and G. Yetman. 2005. Natural Disaster Hotspots: A Global Risk Analysis. Washington, D.C.: World Bank. https://doi.org/10.1596/0-8213-5930-4.
- Center for Hazards and Risk Research - CHRR - Columbia University, Center for International Earth Science Information Network - CIESIN - Columbia University, International Bank for Reconstruction and Development - The World Bank, and United Nations Environment Programme Global Resource Information Database Geneva - UNEP/GRID-Geneva. 2005. Global Cyclone Hazard Frequency and Distribution. Palisades, NY: NASA Socioeconomic Data and Applications Center (SEDAC). https://doi.org/10.7927/H4CZ353K.
- Center for Hazards and Risk Research - CHRR - Columbia University, Center for International Earth Science Information Network - CIESIN - Columbia University, and International Research Institute for Climate and Society - IRI - Columbia University. 2005. Global Drought Hazard Frequency and Distribution. Palisades, NY: NASA Socioeconomic Data and Applications Center (SEDAC). https://doi.org/10.7927/H4VX0DFT.
- Center for Hazards and Risk Research - CHRR - Columbia University, Center for International Earth Science Information Network - CIESIN - Columbia University. 2005. Global Flood Hazard Frequency and Distribution. Palisades, NY: NASA Socioeconomic Data and Applications Center (SEDAC). https://doi.org/10.7927/H4668B3D.
- Center for Hazards and Risk Research - CHRR - Columbia University, Center for International Earth Science Information Network - CIESIN - Columbia University. 2005. Global Earthquake Hazard Distribution - Peak Ground Acceleration. Palisades, NY: NASA Socioeconomic Data and Applications Center (SEDAC). https://doi.org/10.7927/H4BZ63ZS.
Aktuelle Erdbeben in der Nähe
Magnitude 3.0 und höher
| Datum▼ | Zeit↕ | Magnitude↕ | Distance↕ | Tiefe↕ | Standort↕ | Verknüpfung |
|---|---|---|---|---|---|---|
| 3/25/19 | 2:53 AM | 4.6 | 56.9 km | 10,000 m | 0km SE of Bagacay, Philippines | usgs.gov |
| 3/20/17 | 7:43 PM | 4.2 | 23.4 km | 51,070 m | 3km WSW of Cogan, Philippines | usgs.gov |
| 3/20/17 | 7:42 PM | 4.3 | 23.5 km | 51,160 m | 6km SE of Buanoy, Philippines | usgs.gov |
| 10/17/16 | 9:02 PM | 4.1 | 50.6 km | 10,000 m | 11km S of Poro, Philippines | usgs.gov |
| 11/2/15 | 5:05 PM | 4.5 | 46.3 km | 10,000 m | 8km ESE of Calumboyan, Philippines | usgs.gov |
| 3/30/15 | 1:47 AM | 4.9 | 48.3 km | 10,000 m | 8km N of San Miguel, Philippines | usgs.gov |
| 11/16/14 | 1:37 PM | 4.5 | 45 km | 56,680 m | 6km SSE of Santiago, Philippines | usgs.gov |
| 11/10/14 | 1:19 AM | 4.5 | 48.2 km | 50,370 m | 4km ESE of Santiago, Philippines | usgs.gov |
| 7/19/14 | 10:21 PM | 4.6 | 62.2 km | 10,000 m | 1km WNW of Nueva Fuerza, Philippines | usgs.gov |
| 7/11/14 | 5:22 AM | 4.4 | 37.9 km | 10,000 m | 2km E of Buenavista, Philippines | usgs.gov |
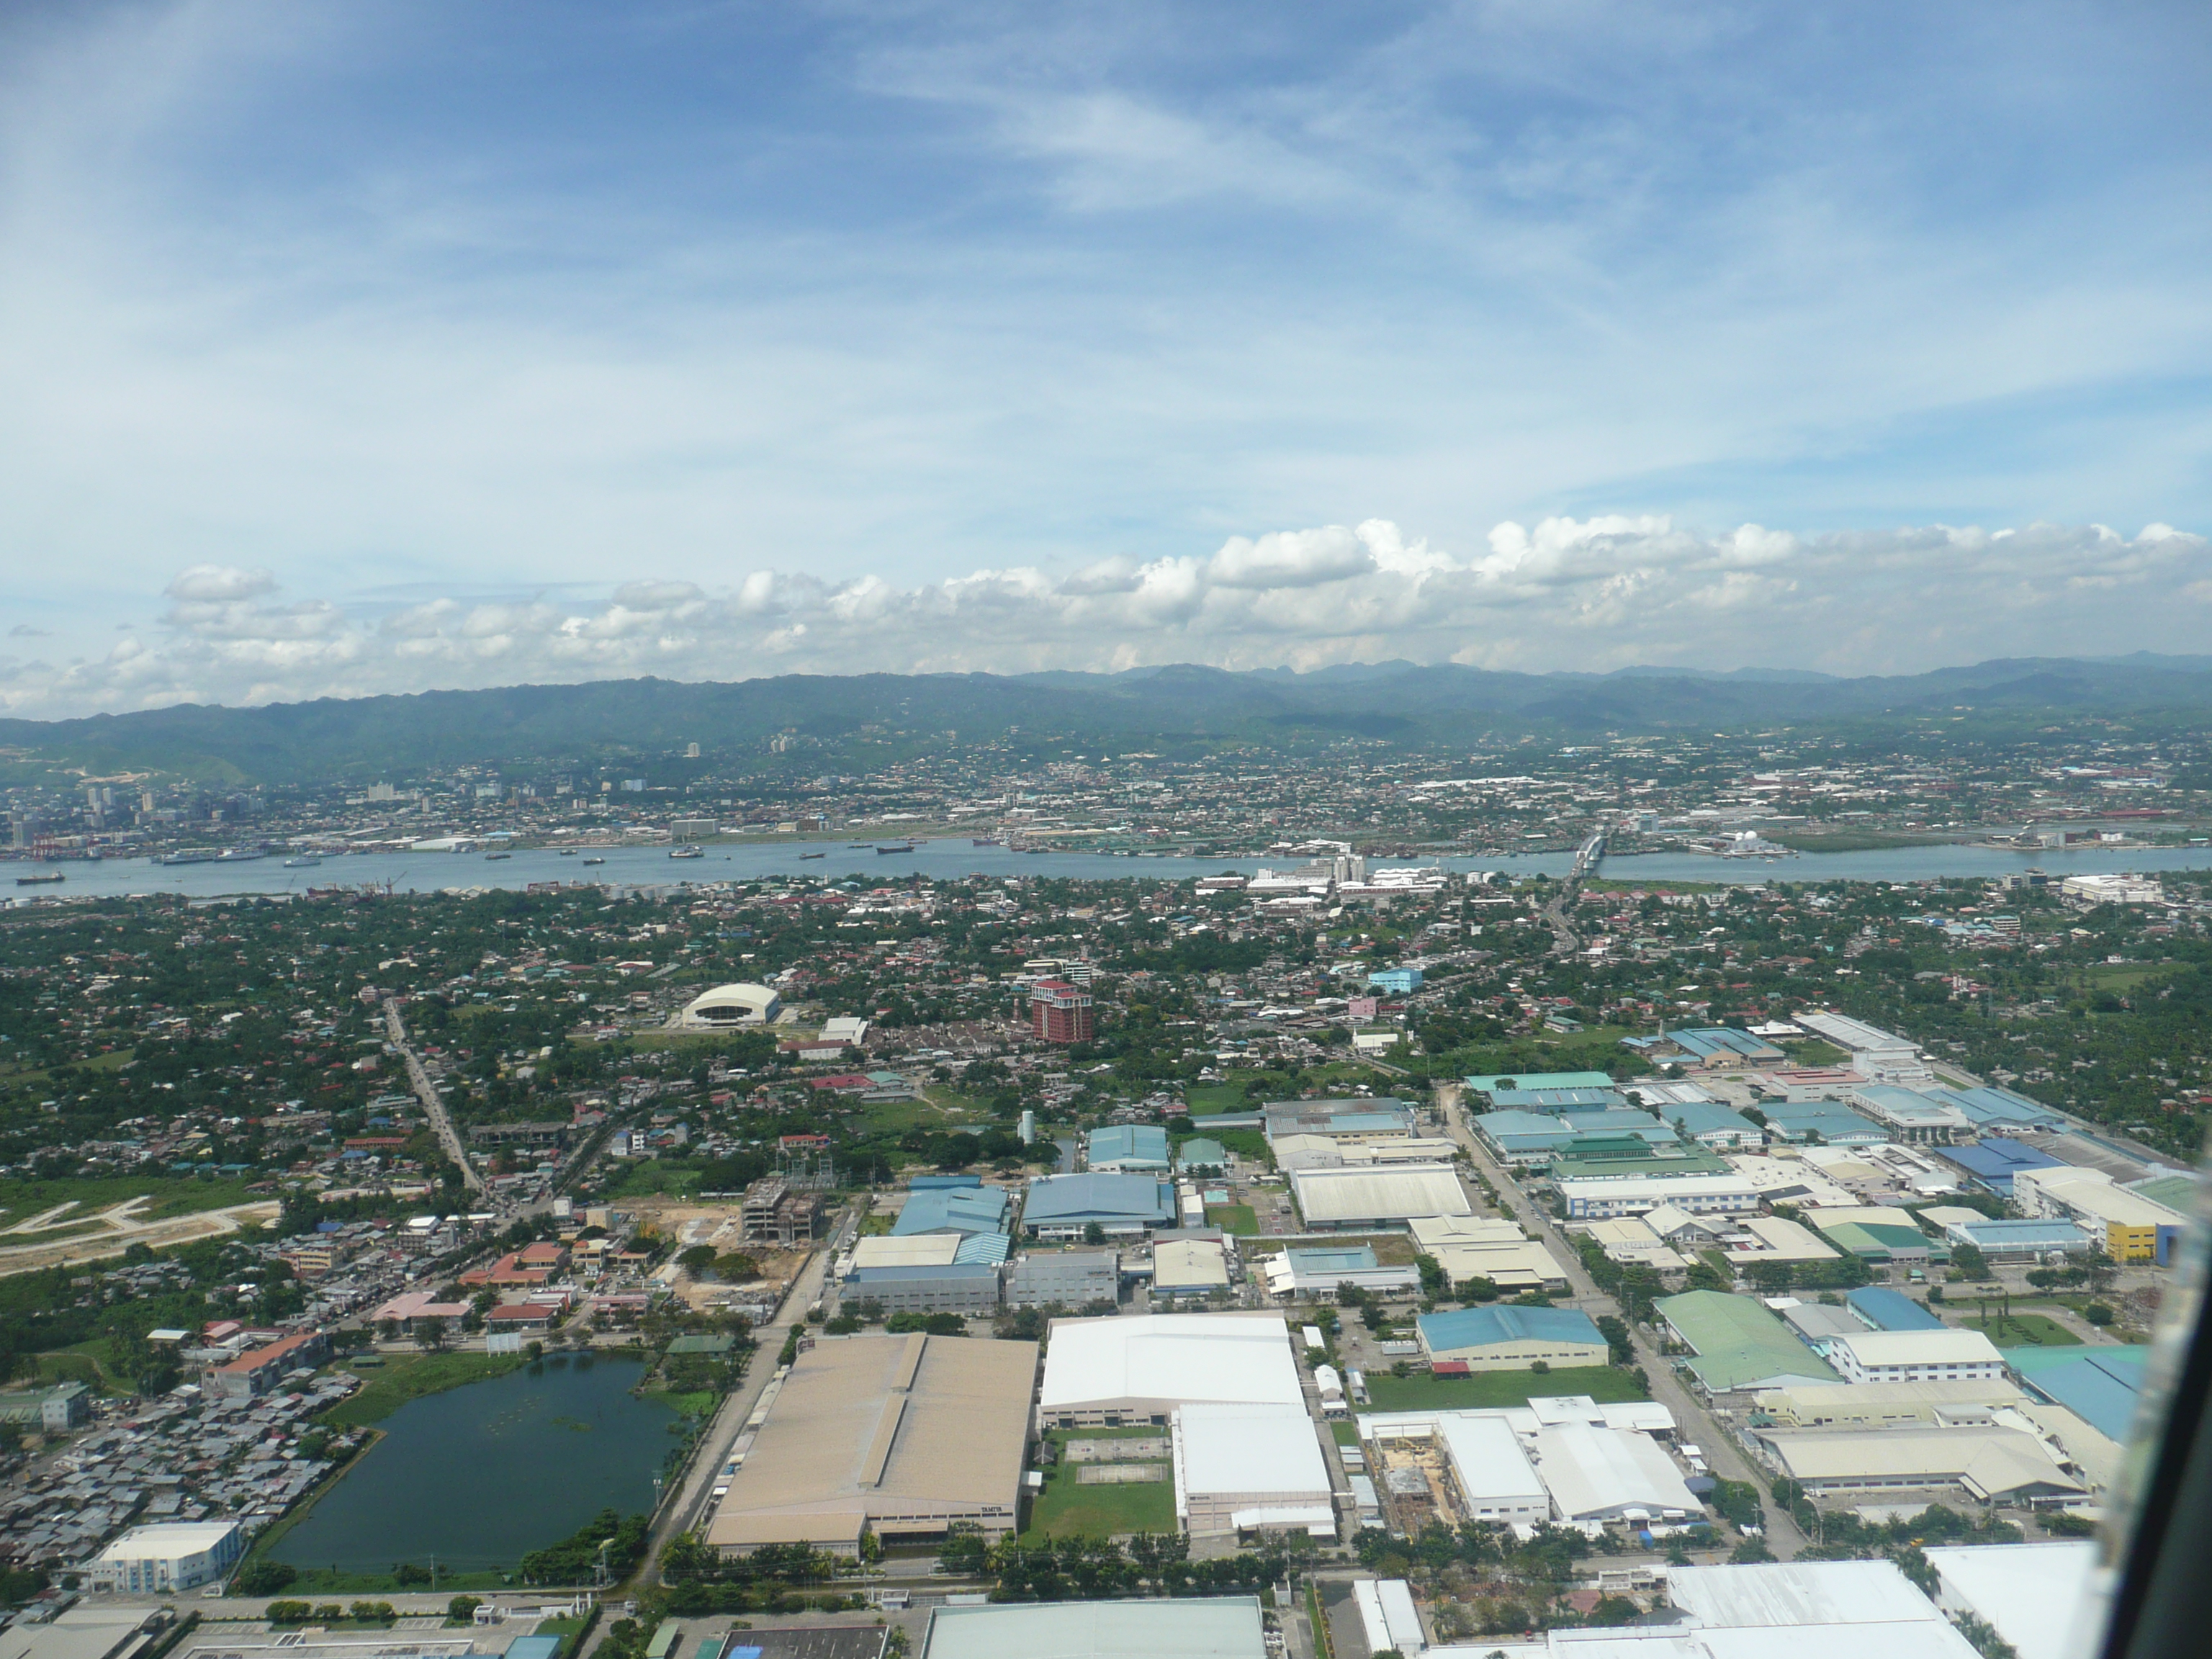
Consolacion
Consolacion (im täglichen Sprachgebrauch oft verkürzt: Lacion) ist eine philippinische Stadtgemeinde in der Provinz Cebu. Sie hat 106.649 Einwohner (Zensus 1. Mai 2010). gehört zur Metropolregion Metro Cebu.
Consolacion Wikipedia-Seite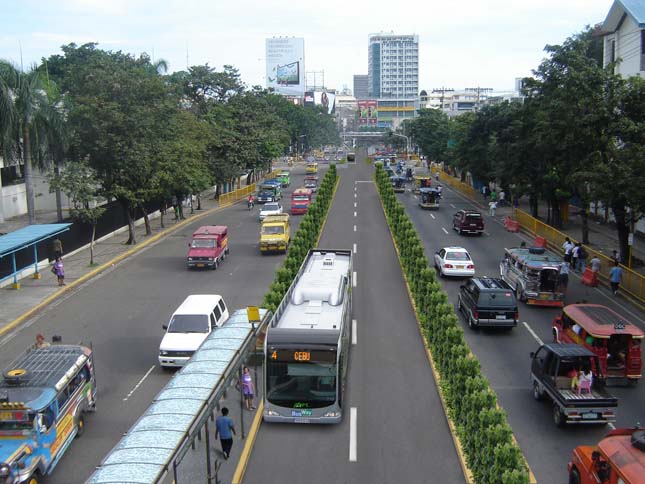

Über unsere Daten
Die Daten auf dieser Seite werden anhand verschiedener öffentlich zugänglicher Werkzeuge und Quellen geschätzt. Sie werden ohne Gewähr bereitgestellt und können Ungenauigkeiten enthalten. Nutzung auf eigene Gefahr.