Kategorien in Looc (Romblon)
Branchen
Unternehmensverteilung nach Branche in Looc (Romblon)
| Branchenbeschreibung | Anzahl der Betriebe |
|---|---|
| Einkaufen | 24 |
| Religion | 21 |
| Sonstige Beherbergungsstätten | 18 |
| Restaurants | 17 |
| Erziehung und Unterricht | 15 |
| Kirchen | 9 |
| Öffentliche Verwaltung | 8 |
| Cafés | 6 |
Looc (Romblon) Facts
| Gebiet | 67.6 km² |
| Bevölkerung | 24.519 |
| Männliche Bevölkerung | 12.524 (51.1%) |
| Weibliche Bevölkerung | 11.995 (48.9%) |
| Population change (1975 to 2020) | +446.7% |
| Population change (2000 to 2020) | +44.2% |
| Mittleres Alter | 22.7 years (Male: 21.7, Female: 23.9) |
| Stadtviertel | Looc (Poblacion), Punta, Alcantara, Buenavista, Guinhayaan |
| Zeit vor Ort | |
| Zeitzone | Philippinische Normalzeit |
| Geogr. Länge & Breite | 12.26050, 121.99260 |
| Postleitzahlen | 5507 |
Karte von Looc (Romblon)
Interaktive Karte
Bevölkerung von Looc (Romblon)
Jahre 1975 bis 2020
| Data | 1975 | 1990 | 2000 | 2015 | 2020 |
|---|---|---|---|---|---|
| Bevölkerung | 4.485 | 12.084 | 17.006 | 22.599 | 24.519 |
| Bevölkerungsdichte | 66,3 / km² | 178,7 / km² | 251,5 / km² | 334,2 / km² | 362,6 / km² |
Bevölkerungsänderung in Looc (Romblon) von 2000 bis 2015
Anstieg um 32.9 % von 2000 bis 2015
| Standort | Änderung seit 1975 | Änderung seit 1990 | Änderung seit 2000 |
|---|---|---|---|
| Looc (Romblon) | +403.9% | +87% | +32.9% |
| Philippinen | +146.5% | +63.3% | +29.5% |
Medianalter von Looc (Romblon)
Medianalter: 22.7 Jahre
| Standort | Mittleres Alter | Durchschnittsalter (weiblich) | Durchschnittsalter (männlich) |
|---|---|---|---|
| Looc (Romblon) | 22.7 yrs | 23.9 yrs | 21.7 yrs |
| Philippinen | 23.2 yrs | 23.6 yrs | 22.8 yrs |
Bevölkerungsdichte von Looc (Romblon)
Bevölkerungsdichte: 363 / km²
| Standort | Bevölkerung | Gebiet | Dichte |
|---|---|---|---|
| Looc (Romblon) | 24.519 | 67,6 km² | 363 / km² |
| Philippinen | 96,6 million | 296.939,4 km² | 325 / km² |
Historische und prognostizierte Bevölkerung von Looc (Romblon)
Geschätzte Bevölkerung von 1870 bis 2100
- JRC (Gemeinsame Forschungsstelle der Europäischen Kommission) arbeitet an GHS built-up grid
- CIESIN (Center for International Earth Science Information Network)
- [Verknüpfung] Klein Goldewijk, K., Beusen, A., Doelman, J., and Stehfest, E.: Anthropogenic land use estimates for the Holocene – HYDE 3.2, Earth Syst. Sci. Data, 9, 927–953, https://doi.org/10.5194/essd-9-927-2017, 2017.
Stadtteile in Looc (Romblon)
Prozentsatz der Unternehmen nach Stadtteil in Looc (Romblon)
Vorwahlen
Prozentuale Vorwahlen, die von Unternehmen in Looc (Romblon) verwendet werden
Postleitzahlen
Prozentsatz der Unternehmen nach Postleitzahl in Looc (Romblon)
Price Distribution
Geschäftsverteilung nach Preis für Looc (Romblon)
Human Development Index (HDI)
Statistischer zusammengesetzter Index der Lebenserwartung, der Bildung und des Pro-Kopf-Einkommens.
CO2-Emissionen von Looc (Romblon)
Kohlendioxid (CO2) -Emissionen pro Kopf in Tonnen pro Jahr
| Standort | CO2-Emissionen | CO2-Emissionen pro Kopf | Intensität der CO2-Emissionen |
|---|---|---|---|
| Looc (Romblon) | 27,338 tn | 1.11 tn | 404.3 tons/km² |
| Philippinen | 104,920,564 tn | 1.09 tn | 353.3 tons/km² |
| CO2-Emissionen 2013 (Tonnen/Jahr) | 27,338 tn |
| CO2-Emissionen 2013 (Tonnen/Jahr) pro Kopf | 1.11 tn |
| CO2-Emissionsintensität 2013 (Tonnen/km²/Jahr) | 404.3 tons/km² |
Naturgefahrenrisiko
Relative risk out of 10
| Gefahr | Risk Level |
|---|---|
| Drought | Medium (7) |
| Earthquake | High (7.9) |
| Cyclone | High (10) |
| Landslide | Medium (6) |
* Risk, particularly concerning flood or landslide, may not be for the entire area.
- Dilley, M., R.S. Chen, U. Deichmann, A.L. Lerner-Lam, M. Arnold, J. Agwe, P. Buys, O. Kjekstad, B. Lyon, and G. Yetman. 2005. Natural Disaster Hotspots: A Global Risk Analysis. Washington, D.C.: World Bank. https://doi.org/10.1596/0-8213-5930-4.
- Center for Hazards and Risk Research - CHRR - Columbia University, Center for International Earth Science Information Network - CIESIN - Columbia University, and Norwegian Geotechnical Institute - NGI. 2005. Global Landslide Hazard Distribution. Palisades, NY: NASA Socioeconomic Data and Applications Center (SEDAC). https://doi.org/10.7927/H4P848VZ.
- Center for Hazards and Risk Research - CHRR - Columbia University, Center for International Earth Science Information Network - CIESIN - Columbia University, International Bank for Reconstruction and Development - The World Bank, and United Nations Environment Programme Global Resource Information Database Geneva - UNEP/GRID-Geneva. 2005. Global Cyclone Hazard Frequency and Distribution. Palisades, NY: NASA Socioeconomic Data and Applications Center (SEDAC). https://doi.org/10.7927/H4CZ353K.
- Center for Hazards and Risk Research - CHRR - Columbia University, Center for International Earth Science Information Network - CIESIN - Columbia University, and International Research Institute for Climate and Society - IRI - Columbia University. 2005. Global Drought Hazard Frequency and Distribution. Palisades, NY: NASA Socioeconomic Data and Applications Center (SEDAC). https://doi.org/10.7927/H4VX0DFT.
- Center for Hazards and Risk Research - CHRR - Columbia University, Center for International Earth Science Information Network - CIESIN - Columbia University. 2005. Global Earthquake Hazard Distribution - Peak Ground Acceleration. Palisades, NY: NASA Socioeconomic Data and Applications Center (SEDAC). https://doi.org/10.7927/H4BZ63ZS.
Aktuelle Erdbeben in der Nähe
Magnitude 3.0 und höher
| Datum▼ | Zeit↕ | Magnitude↕ | Distance↕ | Tiefe↕ | Standort↕ | Verknüpfung |
|---|---|---|---|---|---|---|
| 5/1/19 | 3:55 PM | 4.3 | 77.7 km | 56,800 m | 6km WSW of San Mariano, Philippines | usgs.gov |
| 8/24/18 | 6:23 PM | 4.6 | 85 km | 77,500 m | 10km ESE of Calamundingan, Philippines | usgs.gov |
| 6/1/18 | 9:28 PM | 4.4 | 3.3 km | 34,920 m | 2km S of Limon, Philippines | usgs.gov |
| 4/7/18 | 3:31 AM | 4.4 | 88.2 km | 10,000 m | 3km W of Tiguisan, Philippines | usgs.gov |
| 2/6/18 | 3:01 PM | 4.6 | 94.1 km | 35,410 m | 27km SW of Pagsangahan, Philippines | usgs.gov |
| 7/13/17 | 11:19 PM | 4.8 | 11.9 km | 10,000 m | 6km ENE of Santa Fe, Philippines | usgs.gov |
| 9/30/16 | 9:40 PM | 4.4 | 20.4 km | 35,000 m | 5km NW of Odiongan, Philippines | usgs.gov |
| 7/24/16 | 4:22 AM | 4.5 | 48 km | 42,810 m | 13km ENE of Caluya, Philippines | usgs.gov |
| 2/17/16 | 6:08 PM | 3.8 | 95.1 km | 37,620 m | 8km WNW of Manika, Philippines | usgs.gov |
| 3/25/15 | 3:46 PM | 4.1 | 76.9 km | 20,540 m | 27km ESE of Tambong, Philippines | usgs.gov |
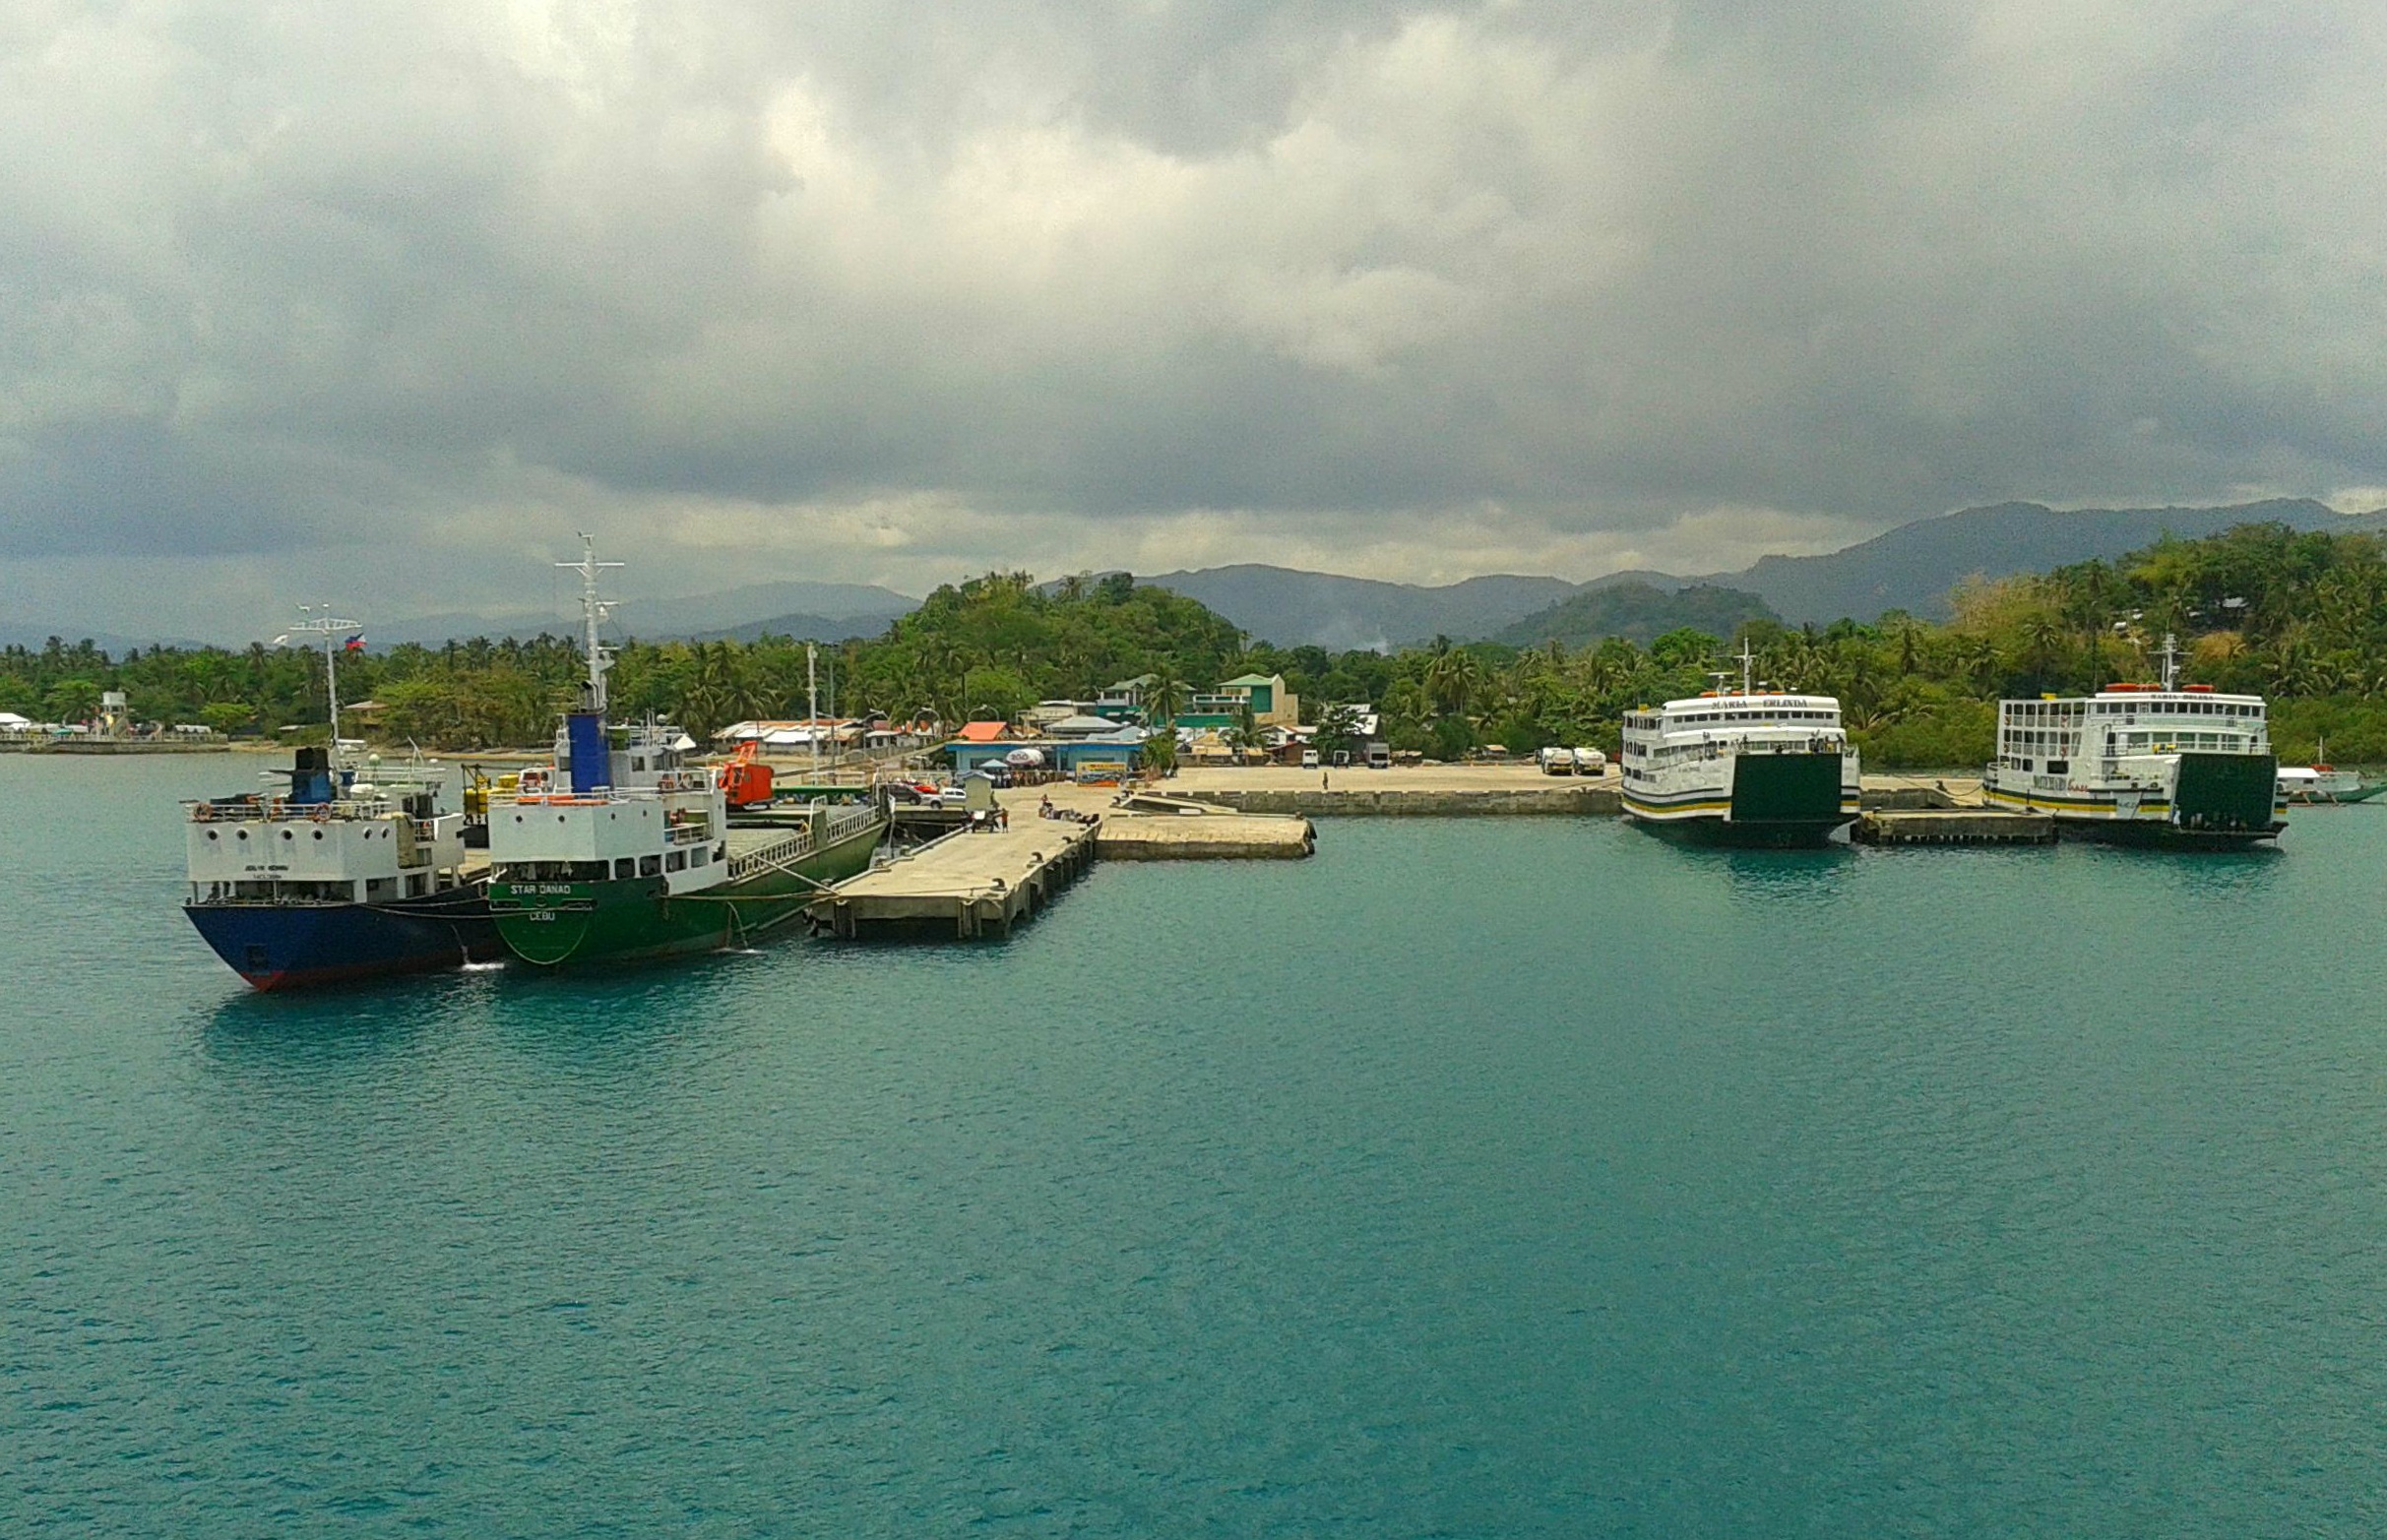
Looc (Romblon)
Looc ist eine philippinische Stadtgemeinde in der Provinz Romblon, in der Verwaltungsregion IV-B, Mimaropa. Sie hat 21.841 Einwohner (Zensus 1. Mai 2010), die in 12 Barangays lebten. Sie wird als Gemeinde der vierten Einkommensklasse auf den Philippinen und al..
Looc (Romblon) Wikipedia-Seite

Über unsere Daten
Die Daten auf dieser Seite werden anhand verschiedener öffentlich zugänglicher Werkzeuge und Quellen geschätzt. Sie werden ohne Gewähr bereitgestellt und können Ungenauigkeiten enthalten. Nutzung auf eigene Gefahr.