Kategorien in Matnog
Branchen
Unternehmensverteilung nach Branche in Matnog
| Branchenbeschreibung | Anzahl der Betriebe |
|---|---|
| Erziehung und Unterricht | 55 |
| Einkaufen | 23 |
| Kirchen | 19 |
| Restaurants | 18 |
| Öffentliche Verwaltung | 16 |
| Sonstige Beherbergungsstätten | 15 |
| Medizin-Klinik | 12 |
| Lebensmittelläden und Supermärkte | 9 |
| Grundschulen | 8 |
Matnog Facts
| Gebiet | 122.6 km² |
| Bevölkerung | 43.728 |
| Männliche Bevölkerung | 22.749 (52.0%) |
| Weibliche Bevölkerung | 20.979 (48.0%) |
| Population change (1975 to 2020) | +795.0% |
| Population change (2000 to 2020) | +75.1% |
| Mittleres Alter | 19.8 years (Male: 19.5, Female: 20.2) |
| Zeit vor Ort | |
| Zeitzone | Philippinische Normalzeit |
| Geogr. Länge & Breite | 12.58780, 124.08750 |
Karte von Matnog
Interaktive Karte
Bevölkerung von Matnog
Jahre 1975 bis 2020
| Data | 1975 | 1990 | 2000 | 2015 | 2020 |
|---|---|---|---|---|---|
| Bevölkerung | 4.886 | 15.388 | 24.975 | 40.348 | 43.728 |
| Bevölkerungsdichte | 39,8 / km² | 125,5 / km² | 203,7 / km² | 329 / km² | 356,6 / km² |
Bevölkerungsänderung in Matnog von 2000 bis 2015
Anstieg um 61.6 % von 2000 bis 2015
| Standort | Änderung seit 1975 | Änderung seit 1990 | Änderung seit 2000 |
|---|---|---|---|
| Matnog | +725.8% | +162.2% | +61.6% |
| Philippinen | +146.5% | +63.3% | +29.5% |
Medianalter von Matnog
Medianalter: 19.8 Jahre
| Standort | Mittleres Alter | Durchschnittsalter (weiblich) | Durchschnittsalter (männlich) |
|---|---|---|---|
| Matnog | 19.8 yrs | 20.2 yrs | 19.5 yrs |
| Philippinen | 23.2 yrs | 23.6 yrs | 22.8 yrs |
Bevölkerungsdichte von Matnog
Bevölkerungsdichte: 357 / km²
| Standort | Bevölkerung | Gebiet | Dichte |
|---|---|---|---|
| Matnog | 43.728 | 122,6 km² | 357 / km² |
| Philippinen | 96,6 million | 296.939,4 km² | 325 / km² |
Historische und prognostizierte Bevölkerung von Matnog
Geschätzte Bevölkerung von 1870 bis 2100
- JRC (Gemeinsame Forschungsstelle der Europäischen Kommission) arbeitet an GHS built-up grid
- CIESIN (Center for International Earth Science Information Network)
- [Verknüpfung] Klein Goldewijk, K., Beusen, A., Doelman, J., and Stehfest, E.: Anthropogenic land use estimates for the Holocene – HYDE 3.2, Earth Syst. Sci. Data, 9, 927–953, https://doi.org/10.5194/essd-9-927-2017, 2017.
Vorwahlen
Prozentuale Vorwahlen, die von Unternehmen in Matnog verwendet werden
Human Development Index (HDI)
Statistischer zusammengesetzter Index der Lebenserwartung, der Bildung und des Pro-Kopf-Einkommens.
CO2-Emissionen von Matnog
Kohlendioxid (CO2) -Emissionen pro Kopf in Tonnen pro Jahr
| Standort | CO2-Emissionen | CO2-Emissionen pro Kopf | Intensität der CO2-Emissionen |
|---|---|---|---|
| Matnog | 46,777 tn | 1.07 tn | 381.5 tons/km² |
| Philippinen | 104,920,564 tn | 1.09 tn | 353.3 tons/km² |
| CO2-Emissionen 2013 (Tonnen/Jahr) | 46,777 tn |
| CO2-Emissionen 2013 (Tonnen/Jahr) pro Kopf | 1.07 tn |
| CO2-Emissionsintensität 2013 (Tonnen/km²/Jahr) | 381.5 tons/km² |
Naturgefahrenrisiko
Relatives Risiko von 10
| Gefahr | Risikostufe |
|---|---|
| Dürre | Mittel (5) |
| Erdbeben | Mittel (6.5) |
| Zyklon | Hoch (10) |
| Erdrutsch | Hoch (8) |
| Vulkan | Mittel (6) |
* Das Risiko, insbesondere in Bezug auf Überschwemmungen oder Erdrutsche, gilt möglicherweise nicht für das gesamte Gebiet.
- Dilley, M., R.S. Chen, U. Deichmann, A.L. Lerner-Lam, M. Arnold, J. Agwe, P. Buys, O. Kjekstad, B. Lyon, and G. Yetman. 2005. Natural Disaster Hotspots: A Global Risk Analysis. Washington, D.C.: World Bank. https://doi.org/10.1596/0-8213-5930-4.
- Center for Hazards and Risk Research - CHRR - Columbia University, Center for International Earth Science Information Network - CIESIN - Columbia University, and Norwegian Geotechnical Institute - NGI. 2005. Global Landslide Hazard Distribution. Palisades, NY: NASA Socioeconomic Data and Applications Center (SEDAC). https://doi.org/10.7927/H4P848VZ.
- Center for Hazards and Risk Research - CHRR - Columbia University, Center for International Earth Science Information Network - CIESIN - Columbia University, International Bank for Reconstruction and Development - The World Bank, and United Nations Environment Programme Global Resource Information Database Geneva - UNEP/GRID-Geneva. 2005. Global Cyclone Hazard Frequency and Distribution. Palisades, NY: NASA Socioeconomic Data and Applications Center (SEDAC). https://doi.org/10.7927/H4CZ353K.
- Center for Hazards and Risk Research - CHRR - Columbia University, Center for International Earth Science Information Network - CIESIN - Columbia University, and International Research Institute for Climate and Society - IRI - Columbia University. 2005. Global Drought Hazard Frequency and Distribution. Palisades, NY: NASA Socioeconomic Data and Applications Center (SEDAC). https://doi.org/10.7927/H4VX0DFT.
- Center for Hazards and Risk Research - CHRR - Columbia University, Center for International Earth Science Information Network - CIESIN - Columbia University. 2005. Global Volcano Hazard Frequency and Distribution. Palisades, NY: NASA Socioeconomic Data and Applications Center (SEDAC). https://doi.org/10.7927/H4BR8Q45.
- Center for Hazards and Risk Research - CHRR - Columbia University, Center for International Earth Science Information Network - CIESIN - Columbia University. 2005. Global Earthquake Hazard Distribution - Peak Ground Acceleration. Palisades, NY: NASA Socioeconomic Data and Applications Center (SEDAC). https://doi.org/10.7927/H4BZ63ZS.
Aktuelle Erdbeben in der Nähe
Magnitude 3.0 und höher
| Datum▼ | Zeit↕ | Magnitude↕ | Distance↕ | Tiefe↕ | Standort↕ | Verknüpfung |
|---|---|---|---|---|---|---|
| 6/11/19 | 11:02 PM | 4.5 | 49.9 km | 10,000 m | 2km SSE of Miaga, Philippines | usgs.gov |
| 6/11/19 | 9:03 PM | 4.6 | 36.2 km | 10,000 m | 12km NE of Miaga, Philippines | usgs.gov |
| 6/3/19 | 9:42 AM | 4.6 | 46.7 km | 24,650 m | 6km NNE of Marintoc, Philippines | usgs.gov |
| 3/19/19 | 2:59 AM | 4.2 | 35 km | 113,590 m | 2km N of Casiguran, Philippines | usgs.gov |
| 12/6/18 | 9:26 AM | 4.2 | 44.6 km | 64,430 m | 1km NE of Sorsogon, Philippines | usgs.gov |
| 10/3/18 | 3:46 PM | 4.5 | 21.5 km | 110,670 m | 2km NE of Bulusan, Philippines | usgs.gov |
| 8/8/17 | 6:25 AM | 4.1 | 48.7 km | 114,700 m | 7km NNE of Mobo, Philippines | usgs.gov |
| 7/30/17 | 3:31 PM | 4.4 | 45 km | 76,320 m | 1km SSE of Capuy, Philippines | usgs.gov |
| 7/17/17 | 8:43 AM | 4.4 | 15.1 km | 10,000 m | 8km S of Quezon, Philippines | usgs.gov |
| 2/18/16 | 5:49 PM | 4.6 | 49.3 km | 10,000 m | 7km NE of Masbate, Philippines | usgs.gov |
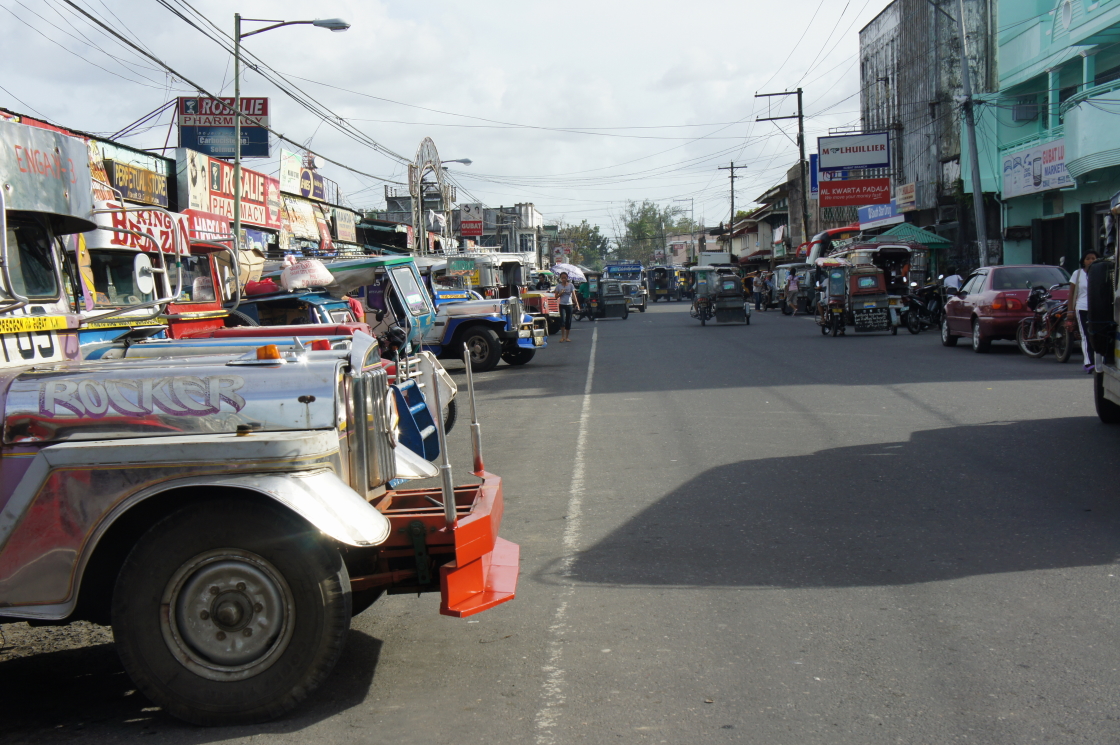
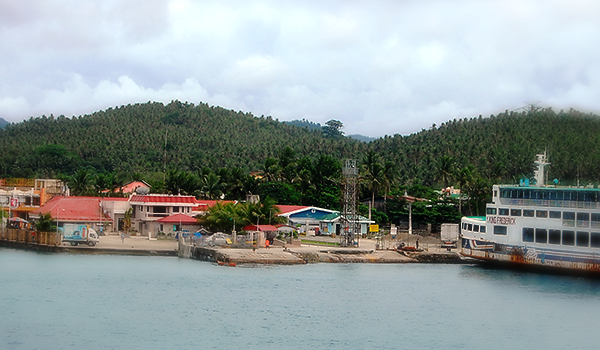
Matnog
Matnog ist eine philippinische Stadtgemeinde in der Provinz Sorsogon. Sie hat 37.641 Einwohner (Zensus 1. Mai 2010), die in 40 Barangays lebten. Matnog gehört zur dritten Einkommensklasse der Gemeinden auf den Philippinen. Sie liegt ca. 48 km südlich der Provi..
Matnog Wikipedia-Seite

Über unsere Daten
Die Daten auf dieser Seite werden anhand verschiedener öffentlich zugänglicher Werkzeuge und Quellen geschätzt. Sie werden ohne Gewähr bereitgestellt und können Ungenauigkeiten enthalten. Nutzung auf eigene Gefahr.