Kategorien in Sariaya
Branchen
Unternehmensverteilung nach Branche in Sariaya
| Branchenbeschreibung | Anzahl der Betriebe | Durchschnittliche Google-Bewertung |
|---|---|---|
| Einkaufen | 55 | 3.9 |
| Erziehung und Unterricht | 52 | 4.3 |
| Kirchen | 25 | 4.3 |
| Darlehensfirmen | 23 | 4.4 |
| Grundschulen | 21 | 4.3 |
| Religion | 21 | 4.3 |
| Sonstige Beherbergungsstätten | 18 | 3.8 |
| Banken | 17 | 3 |
| Bäckereien | 17 | 4 |
| Restaurants | 16 | 3.8 |
| Gesundheit und Medizin | 16 | 4 |
| Alle Lebensmittel und Getränke | 15 | 4 |
| Lebensmittelläden und Supermärkte | 12 | 4.1 |
| Baumarkt | 11 | 5 |
| Allgemeinmediziner | 10 | 5 |
| Ferienhäuser, Hütten und Erholungsorte | 9 | 3.8 |
| Krankenhäuser | 8 | — |
| Finanzen andere | 6 | 4.5 |
| Cafés | 6 | 3.3 |
| Hotels und Motels | 6 | 3.8 |
| Öffentliche Verwaltung | 5 | 4.3 |
| Apotheken und Drogerien | 5 | 3 |
| Büroartikelläden und stationäre Geschäfte | 5 | — |
Sariaya Facts
| Gebiet | 161.1 km² |
| Bevölkerung | 163.124 |
| Männliche Bevölkerung | 82.983 (50.9%) |
| Weibliche Bevölkerung | 80.141 (49.1%) |
| Population change (1975 to 2020) | +715.0% |
| Population change (2000 to 2020) | +67.1% |
| Mittleres Alter | 23.3 years (Male: 22.6, Female: 24) |
| Vorwahlen | 42 |
| Stadtviertel | Bignay 1, Sampaloc, Castañas, Barangay 2, Poblacion 2 |
| Zeit vor Ort | |
| Zeitzone | Philippinische Normalzeit |
| Geogr. Länge & Breite | 13.96240, 121.52650 |
| Postleitzahlen | 4322 |
Karte von Sariaya
Interaktive Karte
Bevölkerung von Sariaya
Jahre 1975 bis 2020
| Data | 1975 | 1990 | 2000 | 2015 | 2020 |
|---|---|---|---|---|---|
| Bevölkerung | 20.015 | 60.541 | 97.621 | 150.530 | 163.124 |
| Bevölkerungsdichte | 124,2 / km² | 375,7 / km² | 605,9 / km² | 934,2 / km² | 1.012,4 / km² |
Bevölkerungsänderung in Sariaya von 2000 bis 2015
Anstieg um 54.2 % von 2000 bis 2015
| Standort | Änderung seit 1975 | Änderung seit 1990 | Änderung seit 2000 |
|---|---|---|---|
| Sariaya | +652.1% | +148.6% | +54.2% |
| Philippinen | +146.5% | +63.3% | +29.5% |
Medianalter von Sariaya
Medianalter: 23.3 Jahre
| Standort | Mittleres Alter | Durchschnittsalter (weiblich) | Durchschnittsalter (männlich) |
|---|---|---|---|
| Sariaya | 23.3 yrs | 24 yrs | 22.6 yrs |
| Philippinen | 23.2 yrs | 23.6 yrs | 22.8 yrs |
Bevölkerungsdichte von Sariaya
Bevölkerungsdichte: 1.012 / km²
| Standort | Bevölkerung | Gebiet | Dichte |
|---|---|---|---|
| Sariaya | 163.124 | 161,1 km² | 1.012 / km² |
| Philippinen | 96,6 million | 296.939,4 km² | 325 / km² |
Historische und prognostizierte Bevölkerung von Sariaya
Geschätzte Bevölkerung von 1900 bis 2100
- JRC (Gemeinsame Forschungsstelle der Europäischen Kommission) arbeitet an GHS built-up grid
- CIESIN (Center for International Earth Science Information Network)
- [Verknüpfung] Klein Goldewijk, K., Beusen, A., Doelman, J., and Stehfest, E.: Anthropogenic land use estimates for the Holocene – HYDE 3.2, Earth Syst. Sci. Data, 9, 927–953, https://doi.org/10.5194/essd-9-927-2017, 2017.
Vorwahlen
Prozentuale Vorwahlen, die von Unternehmen in Sariaya verwendet werden
Price Distribution
Geschäftsverteilung nach Preis für Sariaya
Human Development Index (HDI)
Statistischer zusammengesetzter Index der Lebenserwartung, der Bildung und des Pro-Kopf-Einkommens.
CO2-Emissionen von Sariaya
Kohlendioxid (CO2) -Emissionen pro Kopf in Tonnen pro Jahr
| Standort | CO2-Emissionen | CO2-Emissionen pro Kopf | Intensität der CO2-Emissionen |
|---|---|---|---|
| Sariaya | 186,057 tn | 1.14 tn | 1,154.7 tons/km² |
| Philippinen | 104,920,564 tn | 1.09 tn | 353.3 tons/km² |
| CO2-Emissionen 2013 (Tonnen/Jahr) | 186,057 tn |
| CO2-Emissionen 2013 (Tonnen/Jahr) pro Kopf | 1.14 tn |
| CO2-Emissionsintensität 2013 (Tonnen/km²/Jahr) | 1,154.7 tons/km² |
Naturgefahrenrisiko
Relative risk out of 10
| Gefahr | Risk Level |
|---|---|
| Drought | Medium (4) |
| Flood | High (10) |
| Earthquake | High (8) |
| Cyclone | High (10) |
| Landslide | High (8) |
* Risk, particularly concerning flood or landslide, may not be for the entire area.
- Dilley, M., R.S. Chen, U. Deichmann, A.L. Lerner-Lam, M. Arnold, J. Agwe, P. Buys, O. Kjekstad, B. Lyon, and G. Yetman. 2005. Natural Disaster Hotspots: A Global Risk Analysis. Washington, D.C.: World Bank. https://doi.org/10.1596/0-8213-5930-4.
- Center for Hazards and Risk Research - CHRR - Columbia University, Center for International Earth Science Information Network - CIESIN - Columbia University, and Norwegian Geotechnical Institute - NGI. 2005. Global Landslide Hazard Distribution. Palisades, NY: NASA Socioeconomic Data and Applications Center (SEDAC). https://doi.org/10.7927/H4P848VZ.
- Center for Hazards and Risk Research - CHRR - Columbia University, Center for International Earth Science Information Network - CIESIN - Columbia University, International Bank for Reconstruction and Development - The World Bank, and United Nations Environment Programme Global Resource Information Database Geneva - UNEP/GRID-Geneva. 2005. Global Cyclone Hazard Frequency and Distribution. Palisades, NY: NASA Socioeconomic Data and Applications Center (SEDAC). https://doi.org/10.7927/H4CZ353K.
- Center for Hazards and Risk Research - CHRR - Columbia University, Center for International Earth Science Information Network - CIESIN - Columbia University, and International Research Institute for Climate and Society - IRI - Columbia University. 2005. Global Drought Hazard Frequency and Distribution. Palisades, NY: NASA Socioeconomic Data and Applications Center (SEDAC). https://doi.org/10.7927/H4VX0DFT.
- Center for Hazards and Risk Research - CHRR - Columbia University, Center for International Earth Science Information Network - CIESIN - Columbia University. 2005. Global Flood Hazard Frequency and Distribution. Palisades, NY: NASA Socioeconomic Data and Applications Center (SEDAC). https://doi.org/10.7927/H4668B3D.
- Center for Hazards and Risk Research - CHRR - Columbia University, Center for International Earth Science Information Network - CIESIN - Columbia University. 2005. Global Earthquake Hazard Distribution - Peak Ground Acceleration. Palisades, NY: NASA Socioeconomic Data and Applications Center (SEDAC). https://doi.org/10.7927/H4BZ63ZS.
Aktuelle Erdbeben in der Nähe
Magnitude 3.0 und höher
| Datum▼ | Zeit↕ | Magnitude↕ | Distance↕ | Tiefe↕ | Standort↕ | Verknüpfung |
|---|---|---|---|---|---|---|
| 7/4/19 | 3:00 AM | 4.5 | 10.2 km | 10,000 m | 0km SSE of Montecillo, Philippines | usgs.gov |
| 3/30/19 | 2:02 PM | 4.6 | 58.9 km | 124,220 m | 3km E of Ilijan, Philippines | usgs.gov |
| 2/6/19 | 6:01 AM | 4.6 | 36 km | 10,000 m | 5km S of Marao, Philippines | usgs.gov |
| 12/18/18 | 4:05 AM | 4.2 | 56.1 km | 159,470 m | 1km WNW of Haligue, Philippines | usgs.gov |
| 11/20/18 | 1:58 AM | 4.5 | 56 km | 164,650 m | 1km SSW of Santo Nino, Philippines | usgs.gov |
| 7/15/18 | 12:45 PM | 4.2 | 55.8 km | 140,750 m | 2km N of San Pascual, Philippines | usgs.gov |
| 10/23/17 | 3:28 PM | 4.5 | 55.2 km | 105,370 m | 5km S of Banalo, Philippines | usgs.gov |
| 9/8/17 | 3:49 PM | 4.3 | 49.5 km | 115,660 m | 4km NNE of Talahib Payap, Philippines | usgs.gov |
| 6/21/17 | 1:18 AM | 4.3 | 34.1 km | 10,000 m | 0km E of San Andres, Philippines | usgs.gov |
| 5/9/17 | 7:06 PM | 4.6 | 48.5 km | 147,340 m | 1km SE of Lobo, Philippines | usgs.gov |
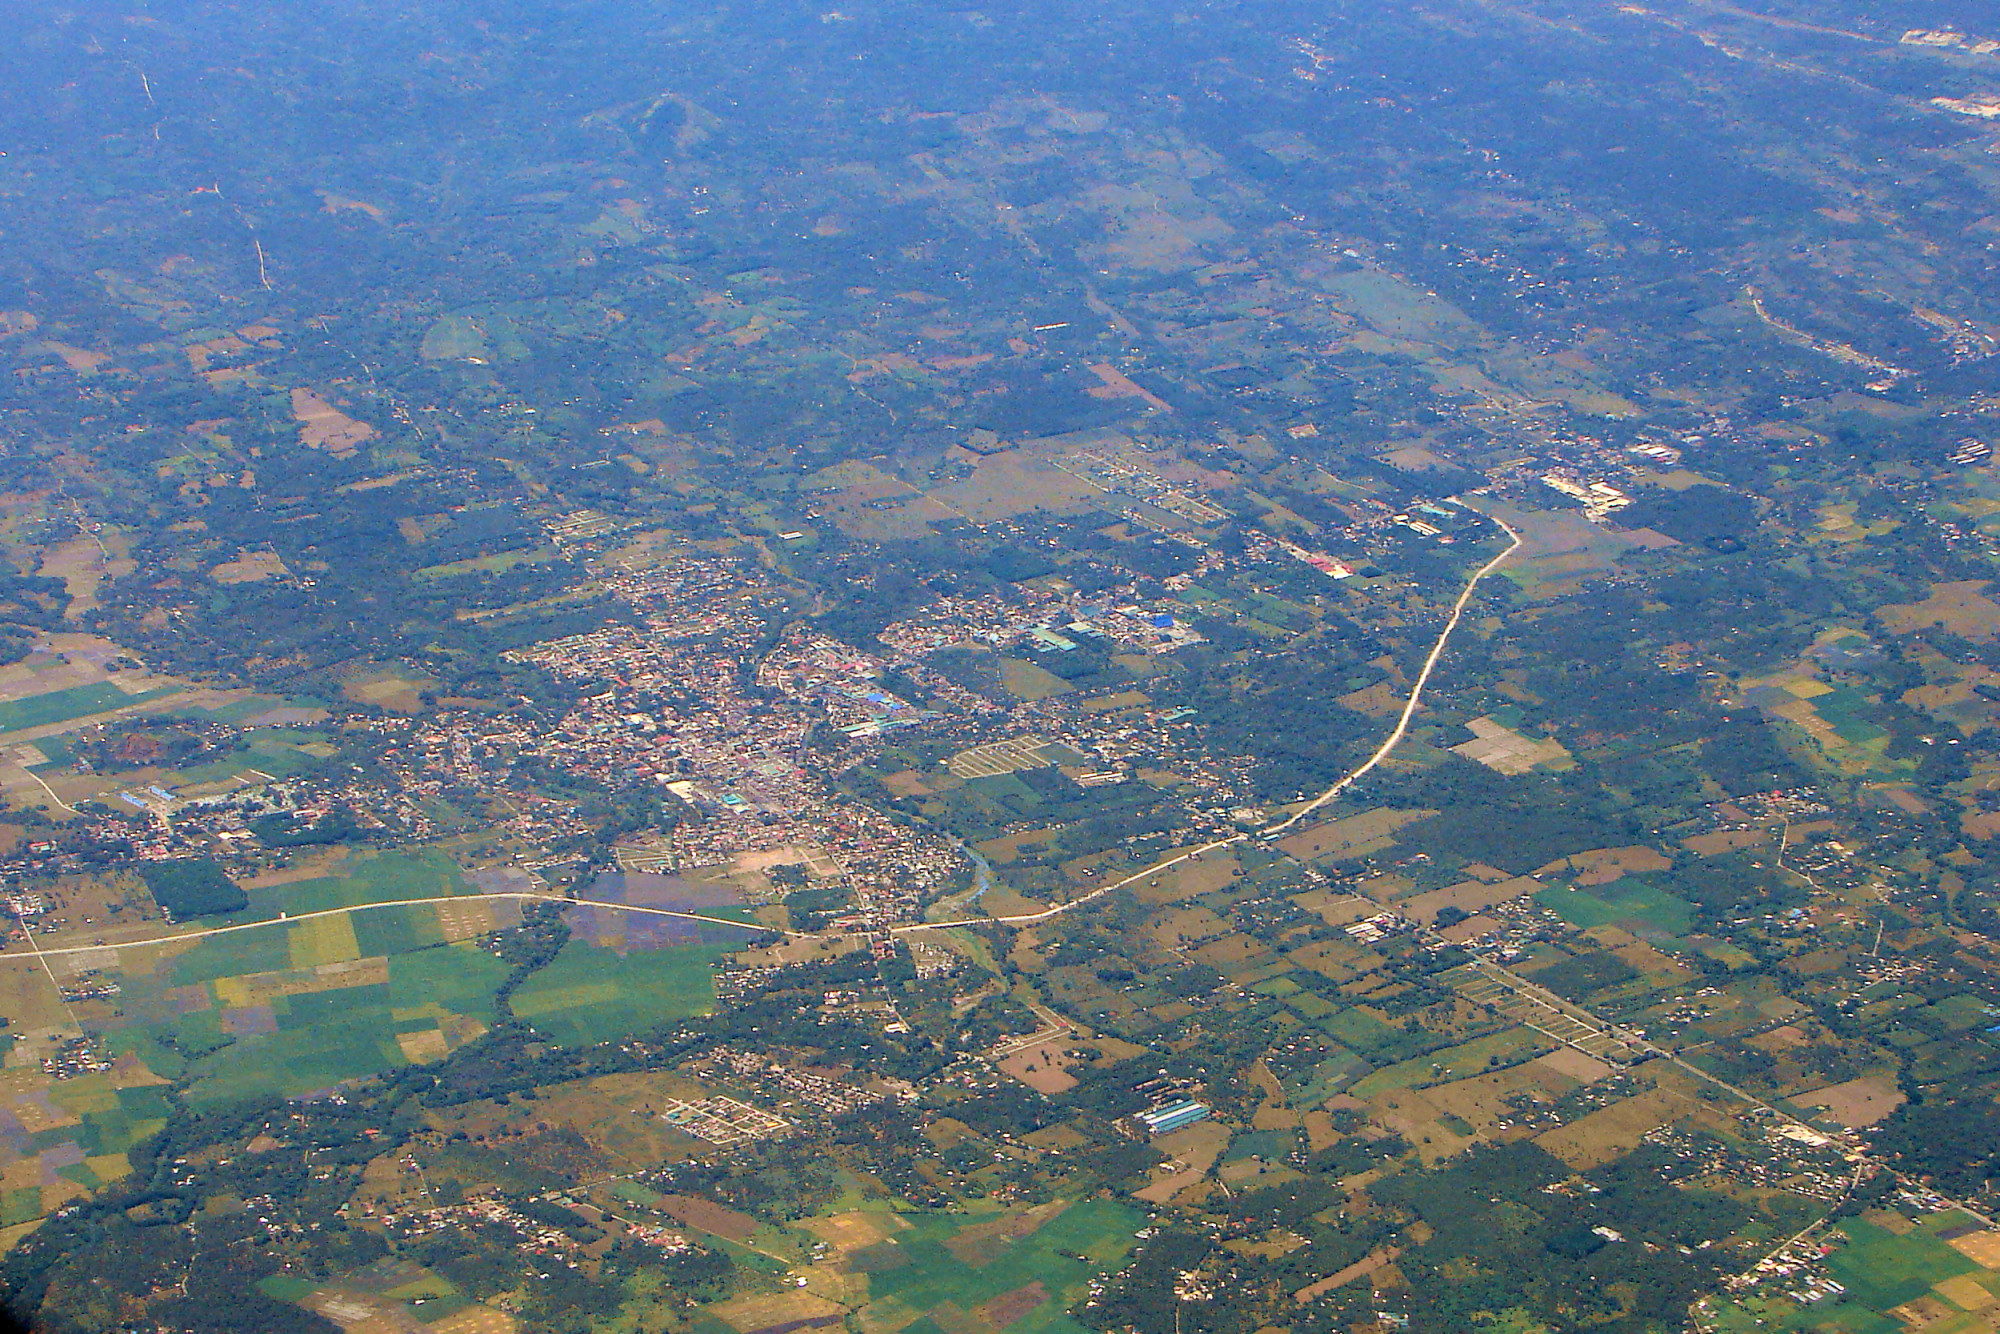
Sariaya
Sariaya (offiziell: Municipality of Sariaya; Filipino: Bayan ng Sariaya) ist eine philippinische Stadtgemeinde in der Provinz Quezon. liegt zwischen dem Vulkan Banahaw und der Tayabasbucht. Durch das Gebiet der Stadtgemeinde fließen die Flüsse Sadyaya, Lagnas..
Sariaya Wikipedia-Seite


Über unsere Daten
Die Daten auf dieser Seite werden anhand verschiedener öffentlich zugänglicher Werkzeuge und Quellen geschätzt. Sie werden ohne Gewähr bereitgestellt und können Ungenauigkeiten enthalten. Nutzung auf eigene Gefahr.