Manhattanville Facts
| Gebiet | 0.2 mi² |
| Bevölkerung | 3.162 |
| Männliche Bevölkerung | 1.457 (46.1%) |
| Weibliche Bevölkerung | 1.705 (53.9%) |
| Population change (1975 to 2020) | +52.4% |
| Population change (2000 to 2020) | +6.4% |
| Mittleres Alter | 38.9 years (Male: 38.6, Female: 39.2) |
| Stadtviertel | West Harlem, Upper Manhattan |
| Zeit vor Ort | |
| Zeitzone | Nordamerikanische Ostküsten-Sommerzeit |
| Geogr. Länge & Breite | 40.81694, -73.95583 |
| Postleitzahlen | 07020, 10025 |
Karte von Manhattanville
Interaktive Karte
Bevölkerung von Manhattanville
Jahre 1975 bis 2020
| Data | 1975 | 1990 | 2000 | 2015 | 2020 |
|---|---|---|---|---|---|
| Bevölkerung | 2.075 | 2.707 | 2.973 | 3.033 | 3.162 |
| Bevölkerungsdichte | 10.748,5 / mi² | 14.022,2 / mi² | 15.400,1 / mi² | 15.710,9 / mi² | 16.379,1 / mi² |
Bevölkerungsänderung in Manhattanville von 2000 bis 2015
Anstieg um 2 % von 2000 bis 2015
| Standort | Änderung seit 1975 | Änderung seit 1990 | Änderung seit 2000 |
|---|---|---|---|
| Manhattanville | +46.2% | +12% | +2% |
| New York (Bundesstaat) | +15.2% | +7.1% | +1.6% |
| Vereinigte Staaten | +46.9% | +27.2% | +13.7% |
Medianalter von Manhattanville
Medianalter: 38.9 Jahre
| Standort | Mittleres Alter | Durchschnittsalter (weiblich) | Durchschnittsalter (männlich) |
|---|---|---|---|
| Manhattanville | 38.9 yrs | 39.2 yrs | 38.6 yrs |
| New York (Bundesstaat) | 38.1 yrs | 39.6 yrs | 36.6 yrs |
| Vereinigte Staaten | 37.4 yrs | 38.7 yrs | 36.1 yrs |
Bevölkerungsdichte von Manhattanville
Bevölkerungsdichte: 16.379 / mi²
| Standort | Bevölkerung | Gebiet | Dichte |
|---|---|---|---|
| Manhattanville | 3.162 | 0,193 sq mi | 16.379 / mi² |
| New York (Bundesstaat) | 19,4 million | 54.555 sq mi | 355 / mi² |
| Vereinigte Staaten | 321,6 million | 3.796.740,8 sq mi | 84,7 / mi² |
Historische und prognostizierte Bevölkerung von Manhattanville
Geschätzte Bevölkerung von 1850 bis 2100
- JRC (Gemeinsame Forschungsstelle der Europäischen Kommission) arbeitet an GHS built-up grid
- CIESIN (Center for International Earth Science Information Network)
- [Verknüpfung] Klein Goldewijk, K., Beusen, A., Doelman, J., and Stehfest, E.: Anthropogenic land use estimates for the Holocene – HYDE 3.2, Earth Syst. Sci. Data, 9, 927–953, https://doi.org/10.5194/essd-9-927-2017, 2017.
Postleitzahlen
Prozentsatz der Unternehmen nach Postleitzahl in Manhattanville
Human Development Index (HDI)
Statistischer zusammengesetzter Index der Lebenserwartung, der Bildung und des Pro-Kopf-Einkommens.
CO2-Emissionen von Manhattanville
Kohlendioxid (CO2) -Emissionen pro Kopf in Tonnen pro Jahr
| Standort | CO2-Emissionen | CO2-Emissionen pro Kopf | Intensität der CO2-Emissionen |
|---|---|---|---|
| Manhattanville | 62,498 tn | 19.77 tn | 323,736 tons/mi² |
| New York (Bundesstaat) | 334,299,374 tn | 17.25 tn | 6,127.8 tons/mi² |
| Vereinigte Staaten | 5,664,619,810 tn | 17.62 tn | 1,492 tons/mi² |
| CO2-Emissionen 2013 (Tonnen/Jahr) | 62,498 tn |
| CO2-Emissionen 2013 (Tonnen/Jahr) pro Kopf | 19.77 tn |
| CO2-Emissionsintensität 2013 (Tonnen/mi²/Jahr) | 323,736 tons/mi² |
Naturgefahrenrisiko
Relative risk out of 10
| Gefahr | Risk Level |
|---|---|
| Flood | Medium (4) |
| Earthquake | Low (2) |
| Cyclone | Medium (7) |
* Risk, particularly concerning flood or landslide, may not be for the entire area.
- Dilley, M., R.S. Chen, U. Deichmann, A.L. Lerner-Lam, M. Arnold, J. Agwe, P. Buys, O. Kjekstad, B. Lyon, and G. Yetman. 2005. Natural Disaster Hotspots: A Global Risk Analysis. Washington, D.C.: World Bank. https://doi.org/10.1596/0-8213-5930-4.
- Center for Hazards and Risk Research - CHRR - Columbia University, Center for International Earth Science Information Network - CIESIN - Columbia University, International Bank for Reconstruction and Development - The World Bank, and United Nations Environment Programme Global Resource Information Database Geneva - UNEP/GRID-Geneva. 2005. Global Cyclone Hazard Frequency and Distribution. Palisades, NY: NASA Socioeconomic Data and Applications Center (SEDAC). https://doi.org/10.7927/H4CZ353K.
- Center for Hazards and Risk Research - CHRR - Columbia University, Center for International Earth Science Information Network - CIESIN - Columbia University. 2005. Global Flood Hazard Frequency and Distribution. Palisades, NY: NASA Socioeconomic Data and Applications Center (SEDAC). https://doi.org/10.7927/H4668B3D.
- Center for Hazards and Risk Research - CHRR - Columbia University, Center for International Earth Science Information Network - CIESIN - Columbia University. 2005. Global Earthquake Hazard Distribution - Peak Ground Acceleration. Palisades, NY: NASA Socioeconomic Data and Applications Center (SEDAC). https://doi.org/10.7927/H4BZ63ZS.
Aktuelle Erdbeben in der Nähe
Magnitude 3.0 und höher
| Datum▼ | Zeit↕ | Magnitude↕ | Distance↕ | Tiefe↕ | Standort↕ | Verknüpfung |
|---|---|---|---|---|---|---|
| 8/26/03 | 6:24 PM | 3.1 | 99.9 km | 2,910 m | New Jersey | usgs.gov |
| 1/9/92 | 8:50 AM | 3.1 | 60 km | 7,900 m | New Jersey | usgs.gov |
| 10/28/91 | 8:58 PM | 3 | 42.5 km | 10,000 m | New York | usgs.gov |
| 10/19/85 | 10:07 AM | 3.6 | 21 km | 6,000 m | New York | usgs.gov |
| 2/26/83 | 7:59 PM | 3 | 85.6 km | 7,000 m | New York | usgs.gov |
| 3/10/79 | 4:49 AM | 3.1 | 47.5 km | 3,000 m | New Jersey | usgs.gov |
| 1/30/79 | 4:30 PM | 3.5 | 60.9 km | 5,000 m | New Jersey | usgs.gov |
| 4/13/76 | 3:39 PM | 3.1 | 6.5 km | 0 m | Greater New York area, New Jersey | usgs.gov |
| 6/7/74 | 7:45 PM | 3.3 | 83.8 km | 2,000 m | New York | usgs.gov |
| 3/23/57 | 7:02 PM | 3.8 | 75.3 km | 10,000 m | New Jersey | usgs.gov |
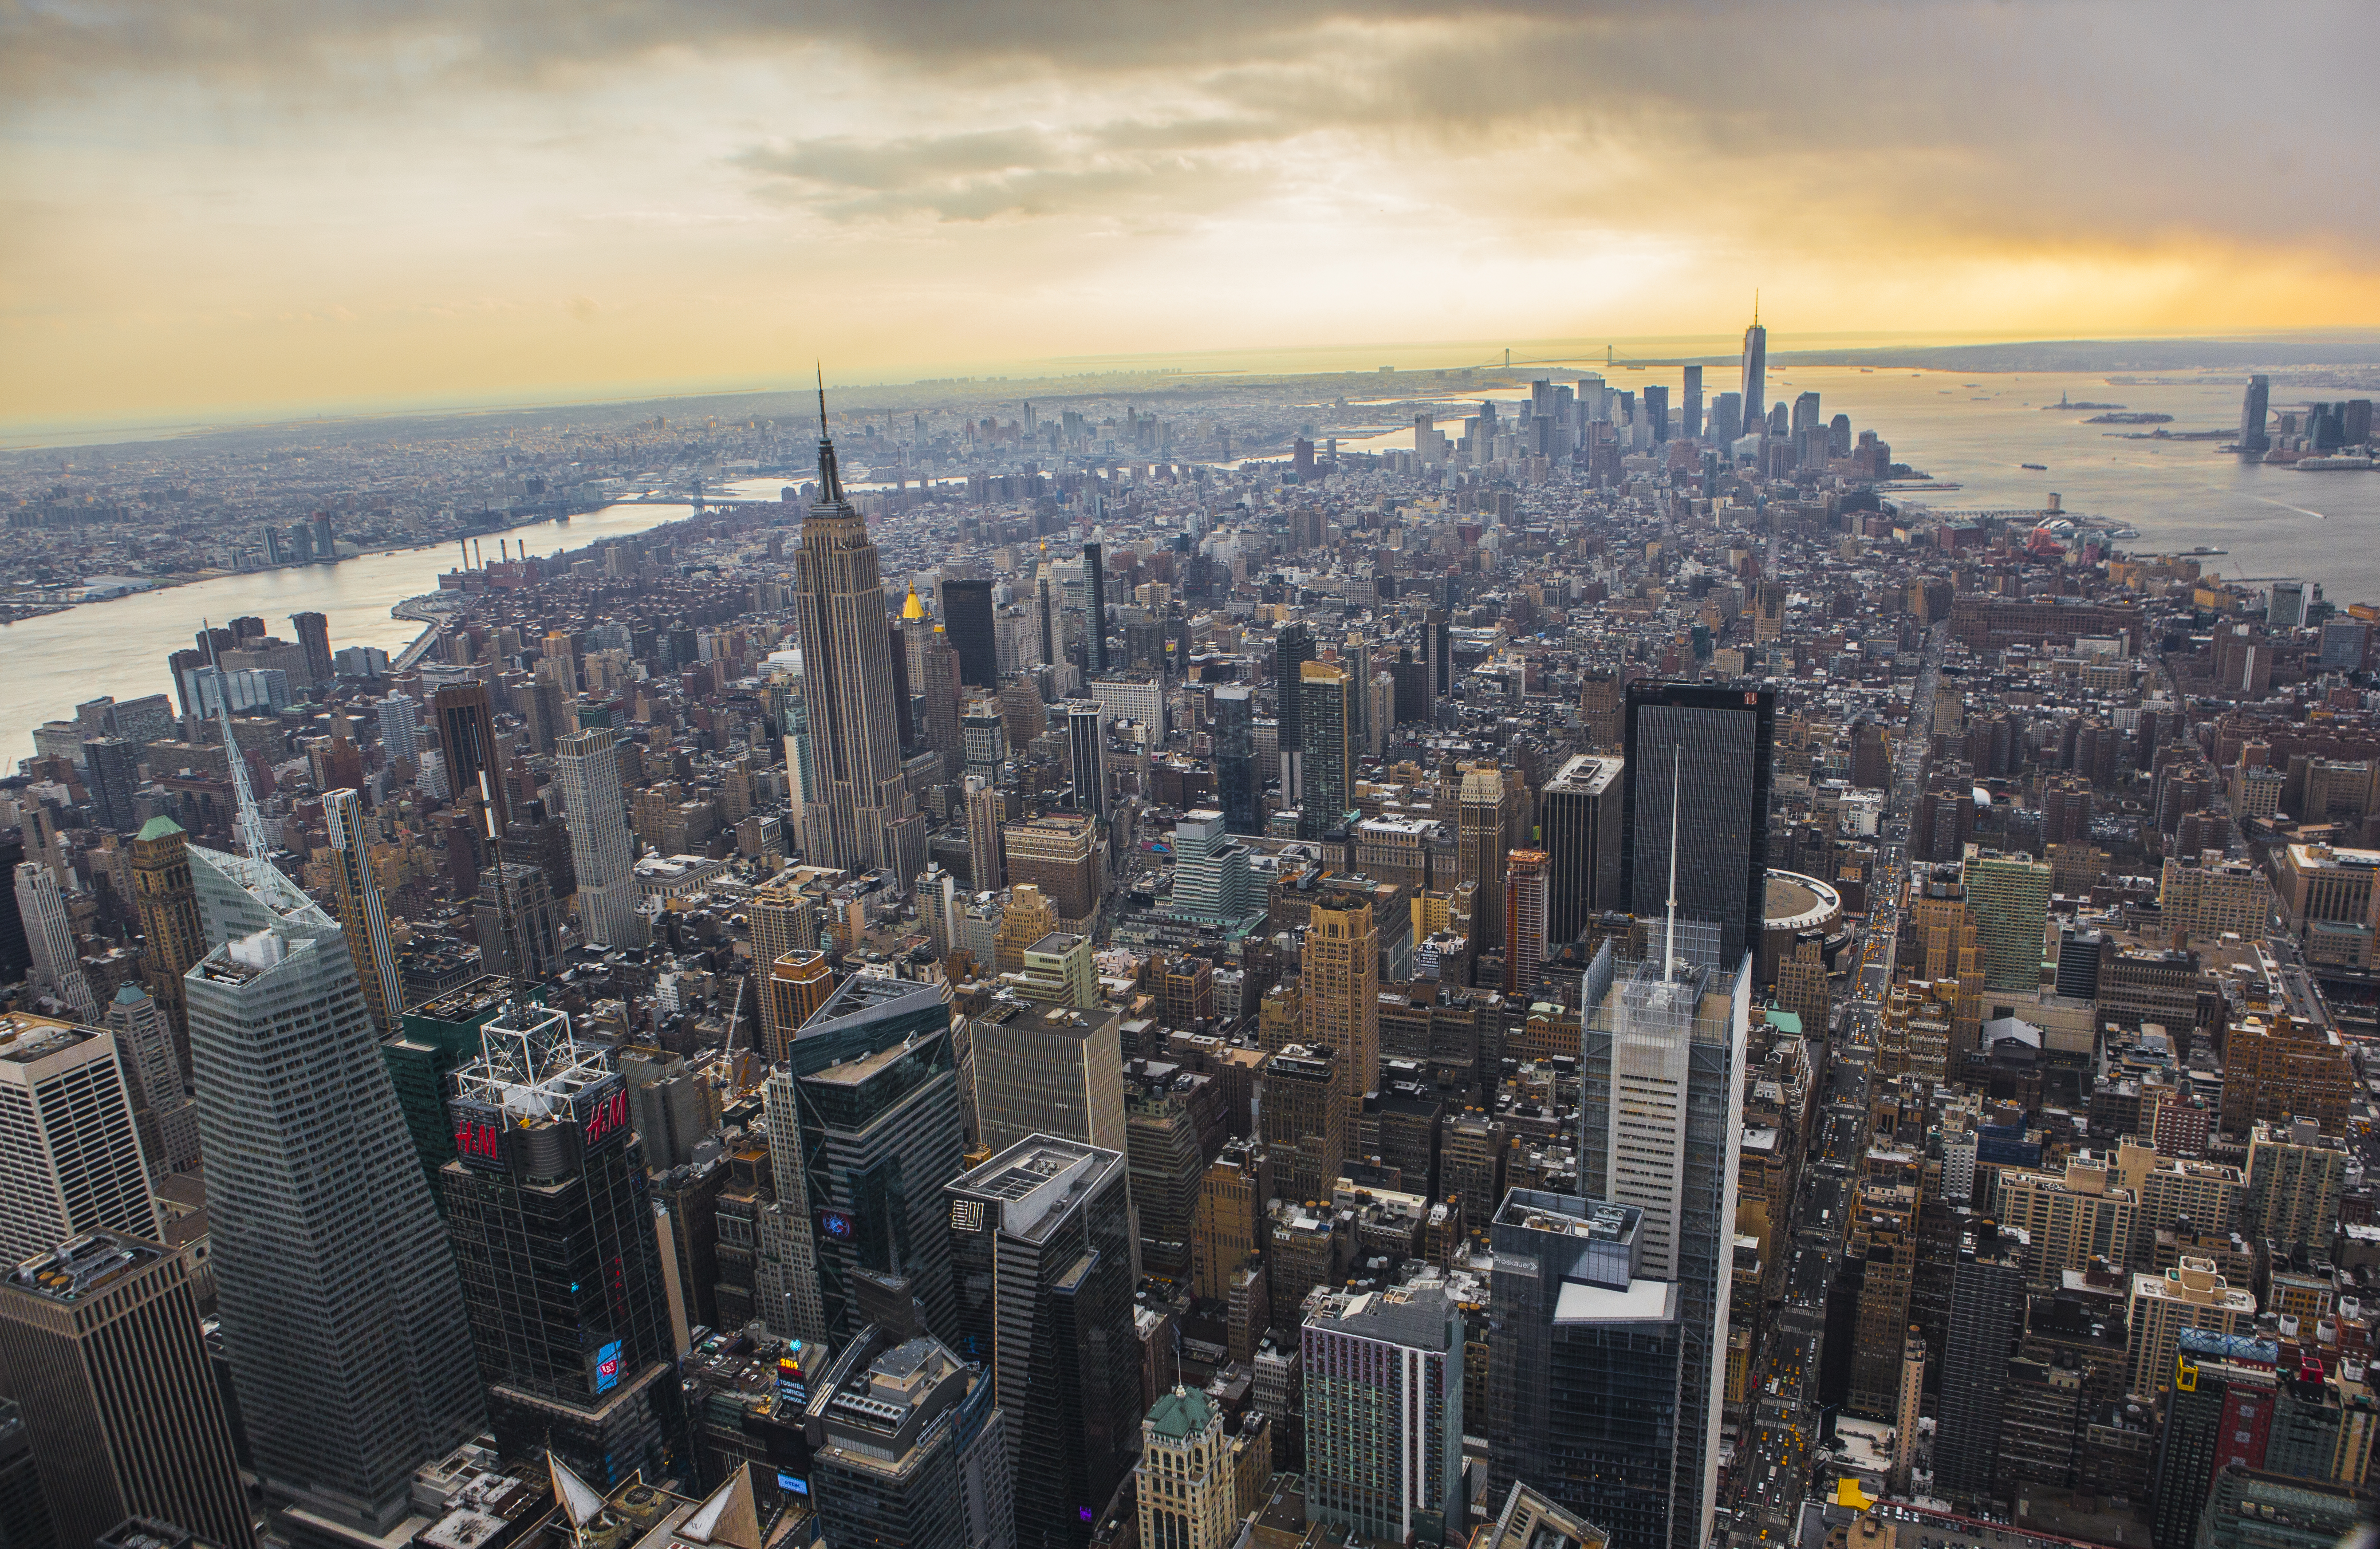
Manhattanville
Manhattanville ist ein Viertel im New Yorker Stadtbezirk Manhattan und der gleichnamigen Insel.
Manhattanville Wikipedia-Seite

Über unsere Daten
Die Daten auf dieser Seite werden anhand verschiedener öffentlich zugänglicher Werkzeuge und Quellen geschätzt. Sie werden ohne Gewähr bereitgestellt und können Ungenauigkeiten enthalten. Nutzung auf eigene Gefahr.