Kategorien in Prescott Valley
Branchen
Unternehmensverteilung nach Branche in Prescott Valley
| Branchenbeschreibung | Anzahl der Betriebe | Durchschnittsalter des Geschäfts |
|---|---|---|
| Gesundheit und Medizin | 442 | 23 years |
| Immobilien | 241 | 21 years |
| Hochbau | 191 | 24 years |
| Restaurants | 172 | 28 years |
| Einkaufen | 169 | 26 years |
| Autoreparatur | 138 | 27 years |
| Andere im Bauwesen | 126 | 25 years |
| Zahnärzte | 109 | 20 years |
| Unternehmensleitung | 104 | 18 years |
| Ärzte und Chirurgen | 94 | 37 years |
| Shopping Sonstige | 82 | 30 years |
| Elektronikläden | 78 | 22 years |
| Sozialarbeit | 78 | 26 years |
| Religion | 75 | 32 years |
| Finanzen andere | 75 | 51 years |
| Schönheitssalon | 74 | 19 years |
Prescott Valley Facts
| Gebiet | 38.9 mi² |
| Bevölkerung | 38.371 |
| Männliche Bevölkerung | 18.619 (48.5%) |
| Weibliche Bevölkerung | 19.752 (51.5%) |
| Population change (1975 to 2020) | +59.8% |
| Population change (2000 to 2020) | +24.6% |
| Mittleres Alter | 40.5 years (Male: 38.7, Female: 42.2) |
| BIP pro Kopf (KKP) | $119.264 (2022) |
| Vorwahlen | 928 |
| Stadtviertel | Prescott Valley Units, Prescott Valley, Lynx Lake Estates, Prescott Valley Business Park, Prescott East |
| Zeit vor Ort | |
| Zeitzone | Rocky-Mountains-Normalzeit |
| Geogr. Länge & Breite | 34.61002, -112.31572 |
| Postleitzahlen | 86312, 86314, 86315 |
Karte von Prescott Valley
Interaktive Karte
Bevölkerung von Prescott Valley
Jahre 1975 bis 2030
| Data | 1975 | 1990 | 2000 | 2015 | 2020 | 2025* | 2030* |
|---|---|---|---|---|---|---|---|
| Bevölkerung | 24.008 | 26.755 | 30.791 | 42.947 | 38.371 | 37.839 | 37.683 |
| Bevölkerungsdichte | 616,4 / mi² | 686,9 / mi² | 790,6 / mi² | 1.102,7 / mi² | 985,2 / mi² | 971,5 / mi² | 967,5 / mi² |
Bevölkerungsänderung in Prescott Valley von 2000 bis 2020
Anstieg um 24.6 % von 2000 bis 2020
| Standort | Änderung seit 1975 | Änderung seit 1990 | Änderung seit 2000 |
|---|---|---|---|
| Prescott Valley | +59.8% | +43.4% | +24.6% |
| Arizona | — | — | — |
| Vereinigte Staaten | — | — | — |
Medianalter von Prescott Valley
Medianalter: 40.5 Jahre
| Standort | Mittleres Alter | Durchschnittsalter (weiblich) | Durchschnittsalter (männlich) |
|---|---|---|---|
| Prescott Valley | 40.5 yrs | 42.2 yrs | 38.7 yrs |
| Arizona | 36 yrs | 37.1 yrs | 34.8 yrs |
| Vereinigte Staaten | 37.4 yrs | 38.7 yrs | 36.1 yrs |
Bevölkerungsdichte von Prescott Valley
Bevölkerungsdichte: 985 / mi²
| Standort | Bevölkerung | Gebiet | Dichte |
|---|---|---|---|
| Prescott Valley | 38.371 | 38,95 sq mi | 985 / mi² |
| Arizona | 7,1 million | 113.990,4 sq mi | 62,4 / mi² |
| Vereinigte Staaten | 321,6 million | 3.796.740,8 sq mi | 84,7 / mi² |
Historische und prognostizierte Bevölkerung von Prescott Valley
Geschätzte Bevölkerung von 1890 bis 2100
- JRC (Gemeinsame Forschungsstelle der Europäischen Kommission) arbeitet an GHS built-up grid
- CIESIN (Center for International Earth Science Information Network)
- [Verknüpfung] Klein Goldewijk, K., Beusen, A., Doelman, J., and Stehfest, E.: Anthropogenic land use estimates for the Holocene – HYDE 3.2, Earth Syst. Sci. Data, 9, 927–953, https://doi.org/10.5194/essd-9-927-2017, 2017.
Stadtteile in Prescott Valley
Prozentsatz der Unternehmen nach Stadtteil in Prescott Valley
Postleitzahlen
Prozentsatz der Unternehmen nach Postleitzahl in Prescott Valley
Price Distribution
Geschäftsverteilung nach Preis für Prescott Valley
Human Development Index (HDI)
Statistischer zusammengesetzter Index der Lebenserwartung, der Bildung und des Pro-Kopf-Einkommens.
Bruttoinlandsprodukt (BIP) von Prescott Valley
BIP pro Kopf, KKP (konstante internationale $ von 2017)
| Data | 1990 | 1995 | 2000 | 2005 | 2010 | 2015 | 2020 | 2022 |
|---|---|---|---|---|---|---|---|---|
| BIP pro Kopf | $31.738 | $29.227 | $36.805 | $37.676 | $34.795 | $71.210 | $112.045 | $119.264 |
| BIP insgesamt | $312,7 Mio. | $362,2 Mio. | $518,2 Mio. | $630,2 Mio. | $615,3 Mio. | $1,2 Mrd. | $1,9 Mrd. | $2 Mrd. |
CO2-Emissionen von Prescott Valley
Kohlendioxid (CO2) -Emissionen pro Kopf in Tonnen pro Jahr
| Standort | CO2-Emissionen | CO2-Emissionen pro Kopf | Intensität der CO2-Emissionen |
|---|---|---|---|
| Prescott Valley | 683,964 tn | 17.83 tn | 17,560.9 tons/mi² |
| Arizona | 120,455,172 tn | 16.95 tn | 1,056.7 tons/mi² |
| Vereinigte Staaten | 5,664,619,810 tn | 17.62 tn | 1,492 tons/mi² |
| CO2-Emissionen 2013 (Tonnen/Jahr) | 683,964 tn |
| CO2-Emissionen 2013 (Tonnen/Jahr) pro Kopf | 17.83 tn |
| CO2-Emissionsintensität 2013 (Tonnen/mi²/Jahr) | 17,560.9 tons/mi² |
Naturgefahrenrisiko
Relatives Risiko von 10
| Gefahr | Risikostufe |
|---|---|
| Dürre | Hoch (9) |
| Erdbeben | Mittel (3.6) |
* Das Risiko, insbesondere in Bezug auf Überschwemmungen oder Erdrutsche, gilt möglicherweise nicht für das gesamte Gebiet.
- Dilley, M., R.S. Chen, U. Deichmann, A.L. Lerner-Lam, M. Arnold, J. Agwe, P. Buys, O. Kjekstad, B. Lyon, and G. Yetman. 2005. Natural Disaster Hotspots: A Global Risk Analysis. Washington, D.C.: World Bank. https://doi.org/10.1596/0-8213-5930-4.
- Center for Hazards and Risk Research - CHRR - Columbia University, Center for International Earth Science Information Network - CIESIN - Columbia University, and International Research Institute for Climate and Society - IRI - Columbia University. 2005. Global Drought Hazard Frequency and Distribution. Palisades, NY: NASA Socioeconomic Data and Applications Center (SEDAC). https://doi.org/10.7927/H4VX0DFT.
- Center for Hazards and Risk Research - CHRR - Columbia University, Center for International Earth Science Information Network - CIESIN - Columbia University. 2005. Global Earthquake Hazard Distribution - Peak Ground Acceleration. Palisades, NY: NASA Socioeconomic Data and Applications Center (SEDAC). https://doi.org/10.7927/H4BZ63ZS.
Aktuelle Erdbeben in der Nähe
Magnitude 3.0 und höher
| Datum▼ | Zeit↕ | Magnitude↕ | Distance↕ | Tiefe↕ | Standort↕ | Verknüpfung |
|---|---|---|---|---|---|---|
| 12/30/18 | 8:31 PM | 3.2 | 85 km | 5,000 m | 22km E of Seligman, Arizona | usgs.gov |
| 12/30/18 | 9:08 AM | 3 | 83.8 km | 5,000 m | 26km E of Seligman, Arizona | usgs.gov |
| 11/4/18 | 9:31 PM | 3.1 | 94.3 km | 5,000 m | 10km ESE of Flagstaff, Arizona | usgs.gov |
| 11/2/15 | 6:49 AM | 3.6 | 57.9 km | 6,670 m | 4km NNE of Black Canyon City, Arizona | usgs.gov |
| 11/2/15 | 6:29 AM | 4 | 55.3 km | 5,920 m | 7km NNE of Black Canyon City, Arizona | usgs.gov |
| 11/2/15 | 3:59 AM | 3.2 | 53.2 km | 5,000 m | 8km N of Black Canyon City, Arizona | usgs.gov |
| 5/5/15 | 9:04 AM | 3.1 | 67.1 km | 7,120 m | 10km NNE of Sedona, Arizona | usgs.gov |
| 3/4/15 | 6:19 AM | 3 | 56.7 km | 5,000 m | 26km ENE of Bagdad, Arizona | usgs.gov |
| 1/17/15 | 11:21 PM | 3.1 | 92.4 km | 11,710 m | 40km N of Bagdad, Arizona | usgs.gov |
| 12/1/14 | 7:53 AM | 3.2 | 65 km | 5,000 m | 12km NNE of West Sedona, Arizona | usgs.gov |
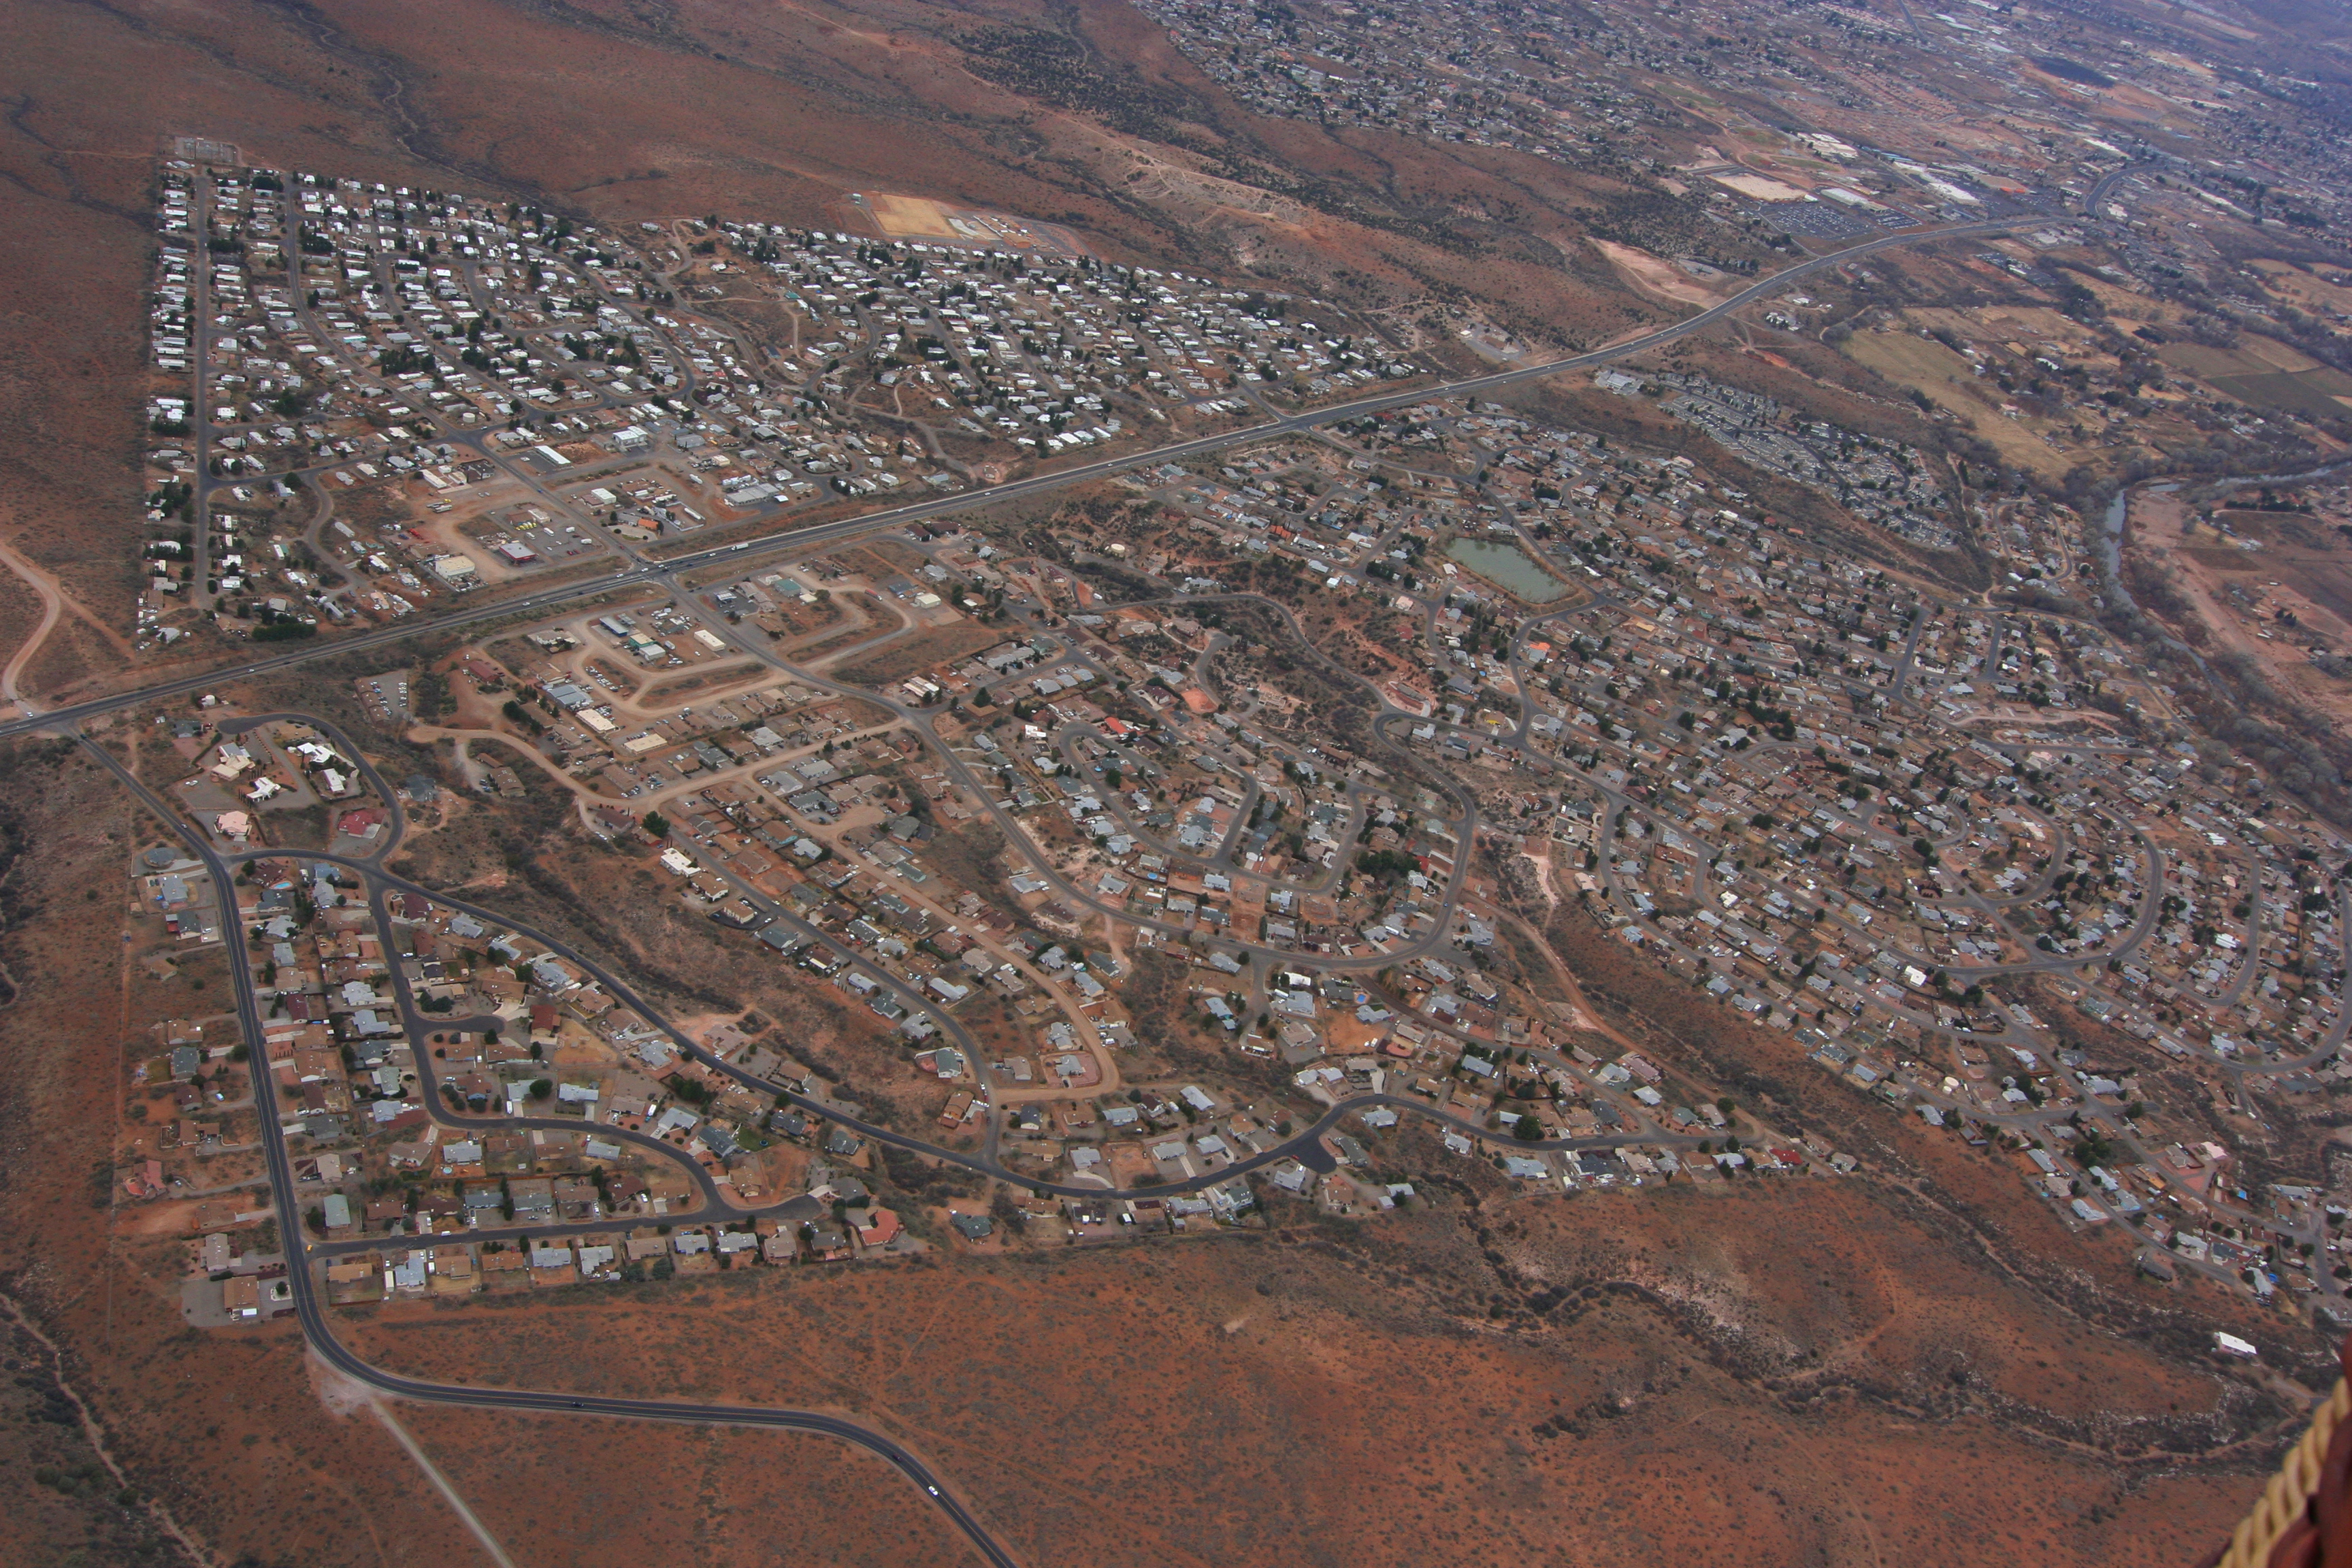
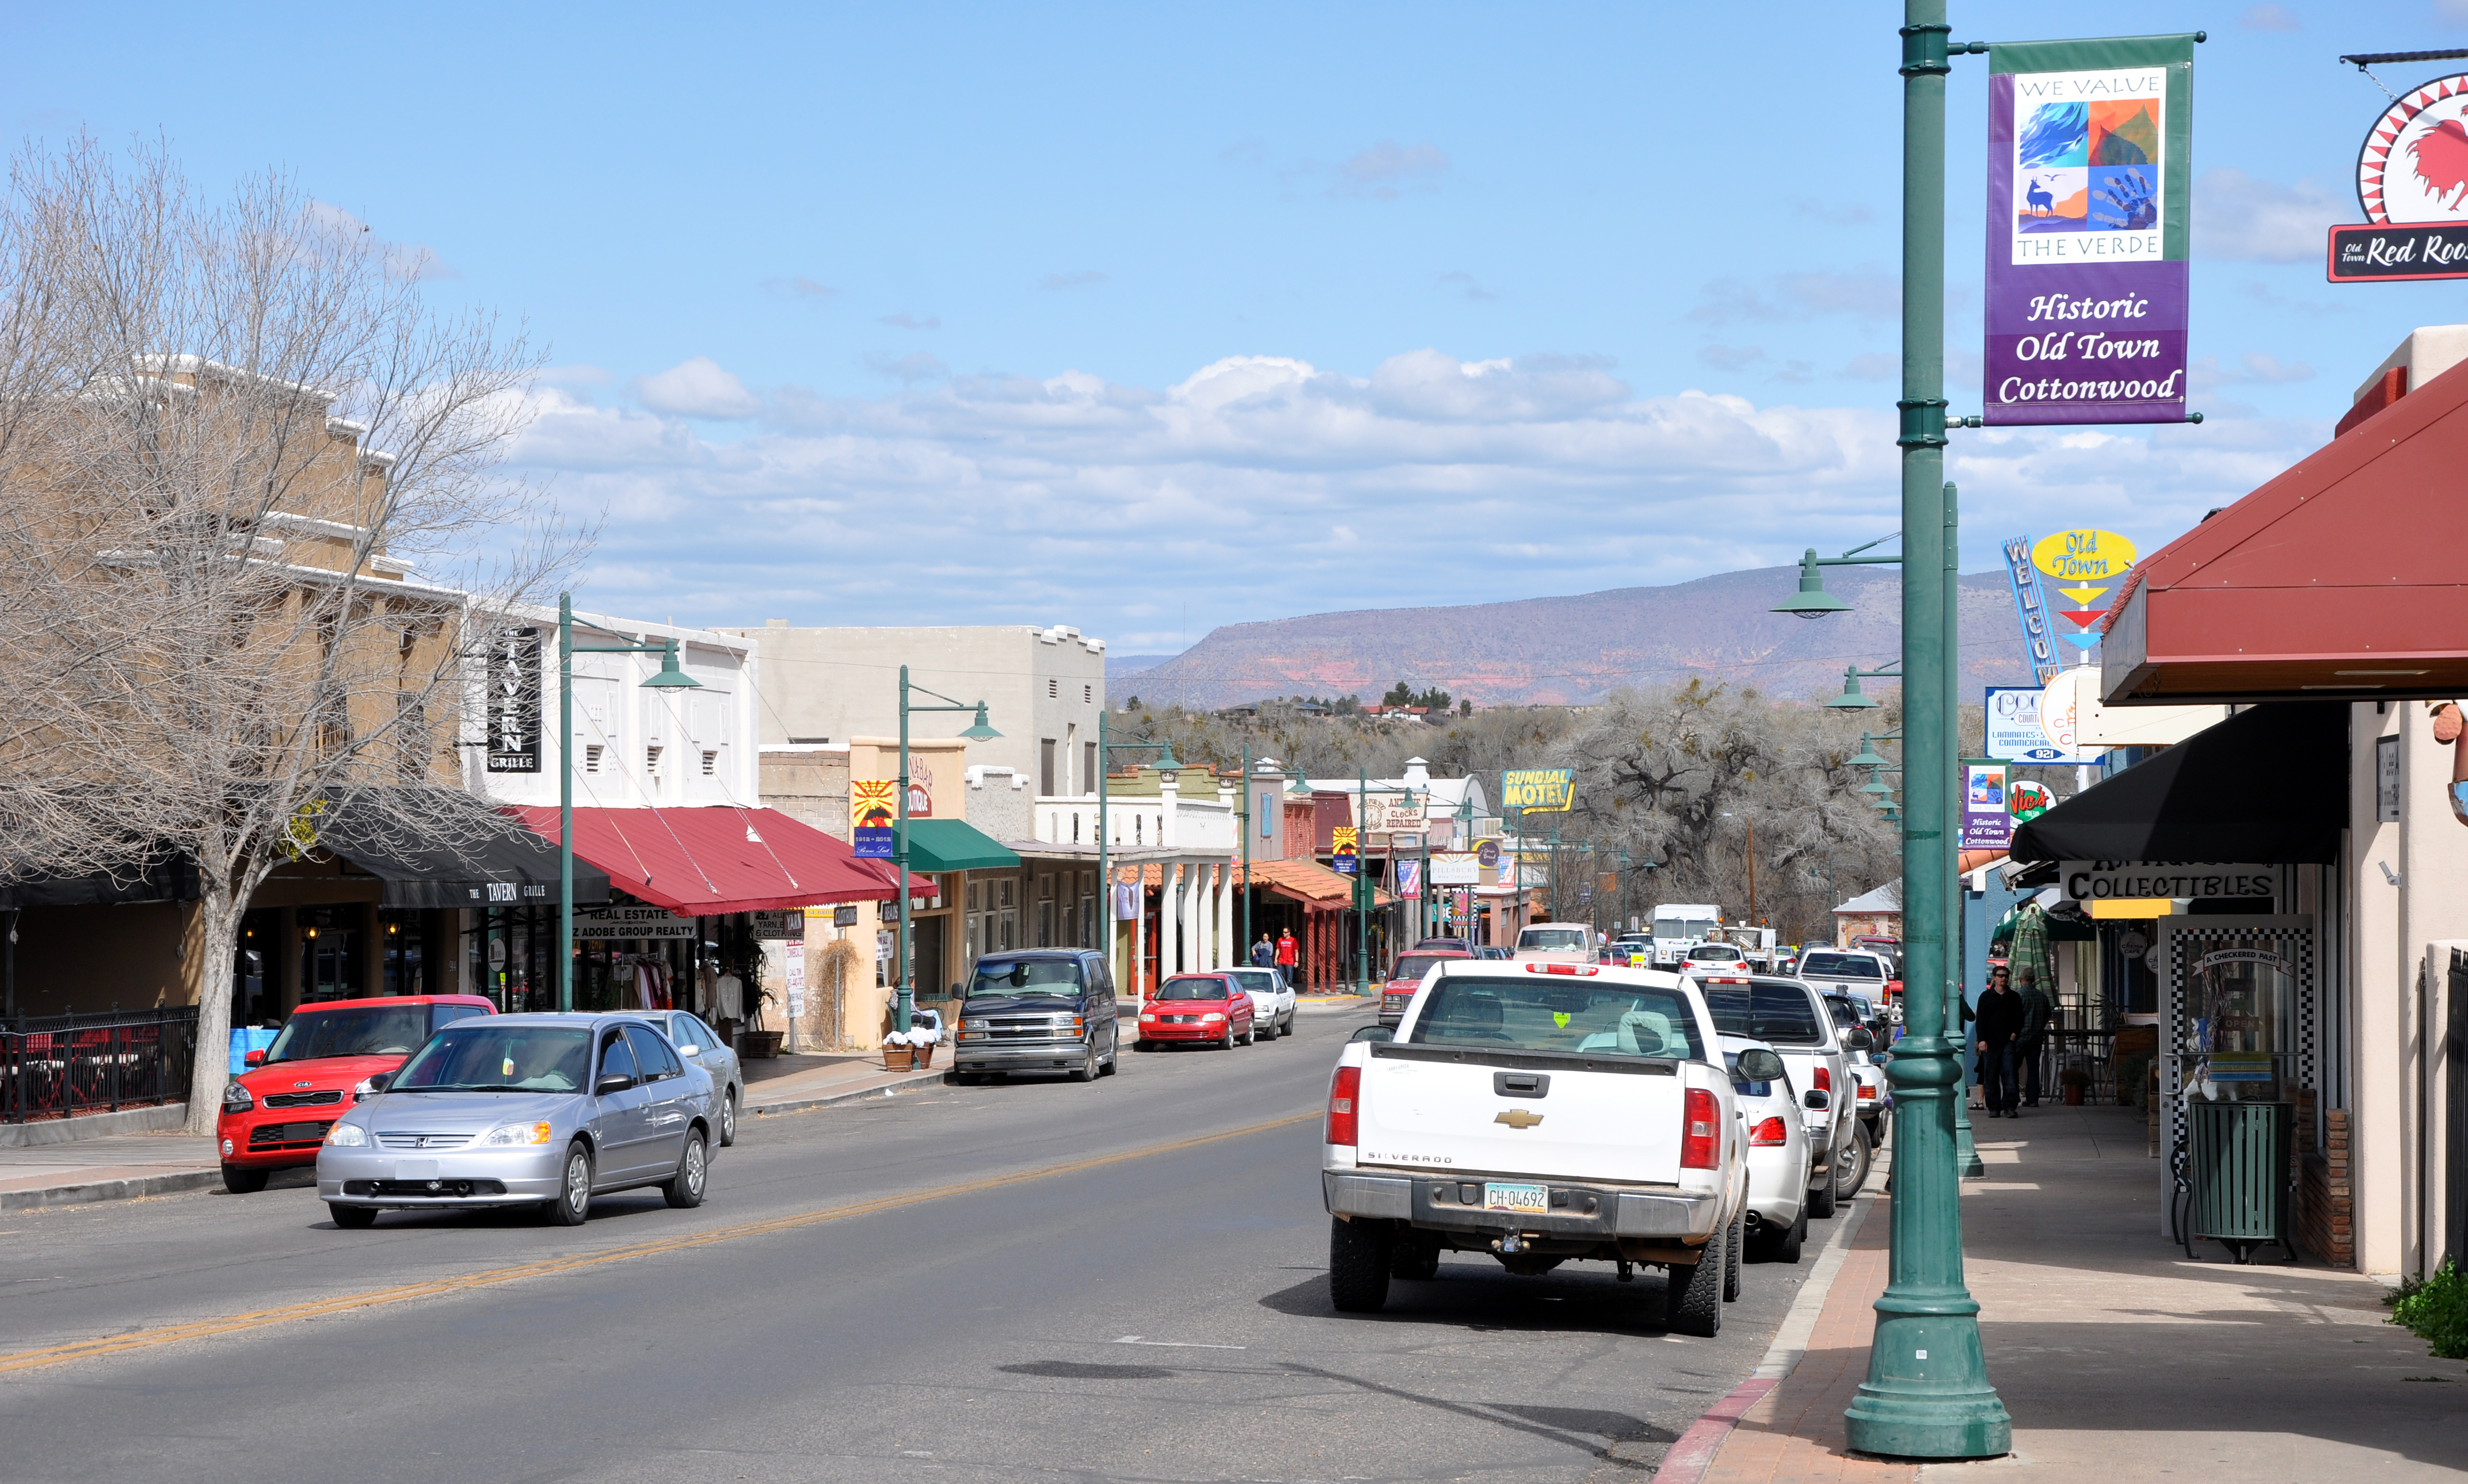
Prescott Valley
Prescott Valley ist eine Town im US-Bundesstaat Arizona, Vereinigte Staaten, mit 29.500 Einwohnern (Stand: 2004). Das Stadtgebiet hat eine Größe von 96,6 km².
Prescott Valley Wikipedia-Seite

Über unsere Daten
Die Daten auf dieser Seite werden anhand verschiedener öffentlich zugänglicher Werkzeuge und Quellen geschätzt. Sie werden ohne Gewähr bereitgestellt und können Ungenauigkeiten enthalten. Nutzung auf eigene Gefahr.