Kategorien in Puerto Cabello
Branchen
Unternehmensverteilung nach Branche in Puerto Cabello
| Branchenbeschreibung | Anzahl der Betriebe |
|---|---|
| Restaurants | 195 |
| Einkaufen | 168 |
| Lebensmittelläden und Supermärkte | 115 |
| Erziehung und Unterricht | 92 |
| Unternehmensleitung | 72 |
| Auto-Teile | 56 |
| Bekleidungsladen | 56 |
| Kirchen | 49 |
| Baumarkt | 49 |
| Autoreparatur | 47 |
| Bäckereien | 47 |
| Zollagenten und Clearingstellen | 42 |
Puerto Cabello Facts
| Gebiet | 468.9 km² |
| Bevölkerung | 199.209 |
| Männliche Bevölkerung | 98.965 (49.7%) |
| Weibliche Bevölkerung | 100.244 (50.3%) |
| Population change (1975 to 2020) | +44.4% |
| Population change (2000 to 2020) | -5.4% |
| Mittleres Alter | 27.9 years (Male: 27.3, Female: 28.5) |
| BIP pro Kopf (KKP) | $3.933 (2022) |
| Vorwahlen | 242, 259 |
| Stadtviertel | Urbanizacion Cumboto Norte, Urbanización La Sorpresa, Rancho Grande, Urbanización Portuario, Barrio Andres Eloy Blanco |
| Zeit vor Ort | |
| Zeitzone | Venezuela-Zeit |
| Geogr. Länge & Breite | 10.47306, -68.01250 |
| Postleitzahlen | 2050 |
Karte von Puerto Cabello
Interaktive Karte
Bevölkerung von Puerto Cabello
Jahre 1975 bis 2030
| Data | 1975 | 1990 | 2000 | 2015 | 2020 | 2025* | 2030* |
|---|---|---|---|---|---|---|---|
| Bevölkerung | 137.935 | 184.332 | 210.586 | 229.639 | 199.209 | 206.044 | 219.370 |
| Bevölkerungsdichte | 294,1 / km² | 393,1 / km² | 449,1 / km² | 489,7 / km² | 424,8 / km² | 439,4 / km² | 467,8 / km² |
Bevölkerungsänderung in Puerto Cabello von 2000 bis 2020
Rückgang um 5.4 % von 2000 bis 2020
| Standort | Änderung seit 1975 | Änderung seit 1990 | Änderung seit 2000 |
|---|---|---|---|
| Puerto Cabello | +44.4% | +8.1% | -5.4% |
| Carabobo | — | — | — |
| Venezuela | — | — | — |
Medianalter von Puerto Cabello
Medianalter: 27.9 Jahre
| Standort | Mittleres Alter | Durchschnittsalter (weiblich) | Durchschnittsalter (männlich) |
|---|---|---|---|
| Puerto Cabello | 27.9 yrs | 28.5 yrs | 27.3 yrs |
| Carabobo | 28 yrs | 28.6 yrs | 27.3 yrs |
| Venezuela | 27.3 yrs | 27.9 yrs | 26.6 yrs |
Bevölkerungsdichte von Puerto Cabello
Bevölkerungsdichte: 425 / km²
| Standort | Bevölkerung | Gebiet | Dichte |
|---|---|---|---|
| Puerto Cabello | 199.209 | 468,9 km² | 425 / km² |
| Carabobo | 2,6 million | 5.137,2 km² | 498 / km² |
| Venezuela | 30,8 million | 912.498,1 km² | 33,7 / km² |
Historische und prognostizierte Bevölkerung von Puerto Cabello
Geschätzte Bevölkerung von 600 bis 2100
- JRC (Gemeinsame Forschungsstelle der Europäischen Kommission) arbeitet an GHS built-up grid
- CIESIN (Center for International Earth Science Information Network)
- [Verknüpfung] Klein Goldewijk, K., Beusen, A., Doelman, J., and Stehfest, E.: Anthropogenic land use estimates for the Holocene – HYDE 3.2, Earth Syst. Sci. Data, 9, 927–953, https://doi.org/10.5194/essd-9-927-2017, 2017.
Stadtteile in Puerto Cabello
Prozentsatz der Unternehmen nach Stadtteil in Puerto Cabello
Vorwahlen
Prozentuale Vorwahlen, die von Unternehmen in Puerto Cabello verwendet werden
Price Distribution
Geschäftsverteilung nach Preis für Puerto Cabello
Human Development Index (HDI)
Statistischer zusammengesetzter Index der Lebenserwartung, der Bildung und des Pro-Kopf-Einkommens.
Bruttoinlandsprodukt (BIP) von Puerto Cabello
BIP pro Kopf, KKP (konstante internationale $ von 2017)
| Data | 1990 | 1995 | 2000 | 2005 | 2010 | 2015 | 2020 | 2022 |
|---|---|---|---|---|---|---|---|---|
| BIP pro Kopf | $22.162 | $20.474 | $16.540 | $17.844 | $19.332 | $17.131 | $4.557 | $3.933 |
| BIP insgesamt | $3,3 Mrd. | $3,6 Mrd. | $3 Mrd. | $3,3 Mrd. | $3,7 Mrd. | $3,3 Mrd. | $725,5 Mio. | $626,3 Mio. |
CO2-Emissionen von Puerto Cabello
Kohlendioxid (CO2) -Emissionen pro Kopf in Tonnen pro Jahr
| Standort | CO2-Emissionen | CO2-Emissionen pro Kopf | Intensität der CO2-Emissionen |
|---|---|---|---|
| Puerto Cabello | 1,141,173 tn | 5.73 tn | 2,433.5 tons/km² |
| Carabobo | 14,985,715 tn | 5.85 tn | 2,917.1 tons/km² |
| Venezuela | 161,060,019 tn | 5.23 tn | 176.5 tons/km² |
| CO2-Emissionen 2013 (Tonnen/Jahr) | 1,141,173 tn |
| CO2-Emissionen 2013 (Tonnen/Jahr) pro Kopf | 5.73 tn |
| CO2-Emissionsintensität 2013 (Tonnen/km²/Jahr) | 2,433.5 tons/km² |
Naturgefahrenrisiko
Relatives Risiko von 10
| Gefahr | Risikostufe |
|---|---|
| Dürre | Mittel (4) |
| Flut | Hoch (10) |
| Erdbeben | Mittel (6) |
| Erdrutsch | Mittel (6) |
* Das Risiko, insbesondere in Bezug auf Überschwemmungen oder Erdrutsche, gilt möglicherweise nicht für das gesamte Gebiet.
- Dilley, M., R.S. Chen, U. Deichmann, A.L. Lerner-Lam, M. Arnold, J. Agwe, P. Buys, O. Kjekstad, B. Lyon, and G. Yetman. 2005. Natural Disaster Hotspots: A Global Risk Analysis. Washington, D.C.: World Bank. https://doi.org/10.1596/0-8213-5930-4.
- Center for Hazards and Risk Research - CHRR - Columbia University, Center for International Earth Science Information Network - CIESIN - Columbia University, and Norwegian Geotechnical Institute - NGI. 2005. Global Landslide Hazard Distribution. Palisades, NY: NASA Socioeconomic Data and Applications Center (SEDAC). https://doi.org/10.7927/H4P848VZ.
- Center for Hazards and Risk Research - CHRR - Columbia University, Center for International Earth Science Information Network - CIESIN - Columbia University, and International Research Institute for Climate and Society - IRI - Columbia University. 2005. Global Drought Hazard Frequency and Distribution. Palisades, NY: NASA Socioeconomic Data and Applications Center (SEDAC). https://doi.org/10.7927/H4VX0DFT.
- Center for Hazards and Risk Research - CHRR - Columbia University, Center for International Earth Science Information Network - CIESIN - Columbia University. 2005. Global Flood Hazard Frequency and Distribution. Palisades, NY: NASA Socioeconomic Data and Applications Center (SEDAC). https://doi.org/10.7927/H4668B3D.
- Center for Hazards and Risk Research - CHRR - Columbia University, Center for International Earth Science Information Network - CIESIN - Columbia University. 2005. Global Earthquake Hazard Distribution - Peak Ground Acceleration. Palisades, NY: NASA Socioeconomic Data and Applications Center (SEDAC). https://doi.org/10.7927/H4BZ63ZS.
Aktuelle Erdbeben in der Nähe
Magnitude 3.0 und höher
| Datum▼ | Zeit↕ | Magnitude↕ | Distance↕ | Tiefe↕ | Standort↕ | Verknüpfung |
|---|---|---|---|---|---|---|
| 4/16/19 | 8:40 AM | 3.5 | 26.3 km | 10,000 m | 2km SE of San Diego, Venezuela | usgs.gov |
| 1/29/19 | 7:33 AM | 4.1 | 23.5 km | 18,550 m | 1km NE of San Diego, Venezuela | usgs.gov |
| 12/27/18 | 9:24 AM | 4.9 | 25.4 km | 10,000 m | 0km SSE of San Diego, Venezuela | usgs.gov |
| 12/27/18 | 9:13 AM | 4.2 | 24.7 km | 10,000 m | 9km NW of San Joaquin, Venezuela | usgs.gov |
| 12/27/18 | 8:59 AM | 5.4 | 26.1 km | 8,000 m | 5km NW of Guacara, Venezuela | usgs.gov |
| 12/5/18 | 9:33 AM | 4.7 | 69.1 km | 10,000 m | 9km WNW of Farriar, Venezuela | usgs.gov |
| 5/23/18 | 11:23 AM | 4.2 | 17.1 km | 10,000 m | 7km N of San Diego, Venezuela | usgs.gov |
| 4/27/18 | 8:44 AM | 4.7 | 20.5 km | 10,000 m | 4km NE of Naguanagua, Venezuela | usgs.gov |
| 8/16/14 | 12:39 PM | 4 | 38.6 km | 7,700 m | 12km ENE of Ocumare de la Costa, Venezuela | usgs.gov |
| 6/1/14 | 3:51 AM | 3.4 | 38.2 km | 5,000 m | 4km SSE of Los Guayos, Venezuela | usgs.gov |
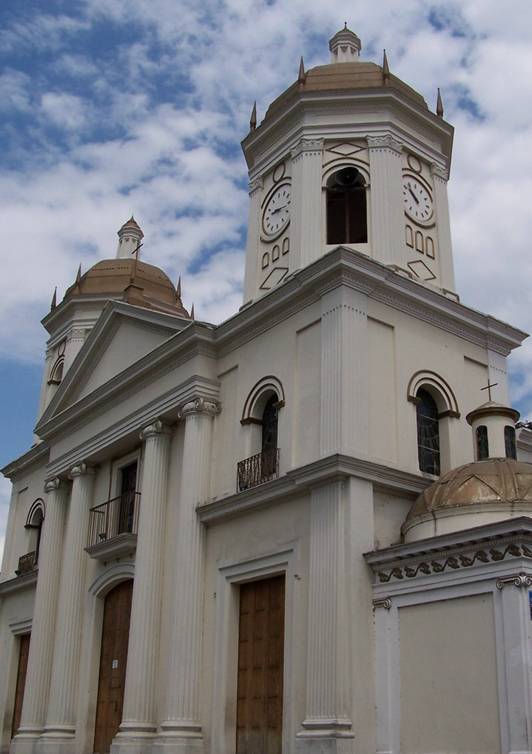
Puerto Cabello
Puerto Cabello ist eine Stadt und der größte Hafen des Landes an der Nordküste von Venezuela, im Bundesstaat Carabobo. Sie befindet sich etwa 75 km westlich von Caracas.
Puerto Cabello Wikipedia-Seite


Über unsere Daten
Die Daten auf dieser Seite werden anhand verschiedener öffentlich zugänglicher Werkzeuge und Quellen geschätzt. Sie werden ohne Gewähr bereitgestellt und können Ungenauigkeiten enthalten. Nutzung auf eigene Gefahr.