Tsingoni Facts
| Gebiet | 28.7 km² |
| Bevölkerung | 13.282 |
| Männliche Bevölkerung | 6.601 (49.7%) |
| Weibliche Bevölkerung | 6.681 (50.3%) |
| Population change (1975 to 2020) | +578.0% |
| Population change (2000 to 2020) | +83.1% |
| Mittleres Alter | 18.4 years (Male: 17.9, Female: 19) |
| Zeit vor Ort | |
| Zeitzone | Ostafrikanische Zeit |
| Geogr. Länge & Breite | -12.78722, 45.10278 |
Karte von Tsingoni
Interaktive Karte
Bevölkerung von Tsingoni
Jahre 1975 bis 2020
| Data | 1975 | 1990 | 2000 | 2015 | 2020 |
|---|---|---|---|---|---|
| Bevölkerung | 1.959 | 4.421 | 7.254 | 11.786 | 13.282 |
| Bevölkerungsdichte | 68,3 / km² | 154,1 / km² | 252,9 / km² | 410,8 / km² | 463 / km² |
Quellen: JRC (Gemeinsame Forschungsstelle der Europäischen Kommission) arbeitet an GHS built-up grid
Bevölkerungsänderung in Tsingoni von 2000 bis 2015
Anstieg um 62.5 % von 2000 bis 2015
| Standort | Änderung seit 1975 | Änderung seit 1990 | Änderung seit 2000 |
|---|---|---|---|
| Tsingoni | +501.6% | +166.6% | +62.5% |
| Mayotte | +428.7% | +154.1% | +60.2% |
Quellen: JRC (Gemeinsame Forschungsstelle der Europäischen Kommission) arbeitet an GHS built-up grid
Medianalter von Tsingoni
Medianalter: 18.4 Jahre
| Standort | Mittleres Alter | Durchschnittsalter (weiblich) | Durchschnittsalter (männlich) |
|---|---|---|---|
| Tsingoni | 18.4 yrs | 19 yrs | 17.9 yrs |
| Mayotte | 17.9 yrs | 18.5 yrs | 17.2 yrs |
Quellen: CIESIN (Center for International Earth Science Information Network)
Bevölkerungsdichte von Tsingoni
Bevölkerungsdichte: 463 / km²
| Standort | Bevölkerung | Gebiet | Dichte |
|---|---|---|---|
| Tsingoni | 13.282 | 28,7 km² | 463 / km² |
| Mayotte | 230.119 | 393,8 km² | 584 / km² |
Quellen: JRC (Gemeinsame Forschungsstelle der Europäischen Kommission) arbeitet an GHS built-up grid
Historische und prognostizierte Bevölkerung von Tsingoni
Geschätzte Bevölkerung von 1750 bis 2100
Quellen:
- JRC (Gemeinsame Forschungsstelle der Europäischen Kommission) arbeitet an GHS built-up grid
- CIESIN (Center for International Earth Science Information Network)
- [Verknüpfung] Klein Goldewijk, K., Beusen, A., Doelman, J., and Stehfest, E.: Anthropogenic land use estimates for the Holocene – HYDE 3.2, Earth Syst. Sci. Data, 9, 927–953, https://doi.org/10.5194/essd-9-927-2017, 2017.
Human Development Index (HDI)
Statistischer zusammengesetzter Index der Lebenserwartung, der Bildung und des Pro-Kopf-Einkommens.
Quelle: [Verknüpfung] Kummu, M., Taka, M. &Guillaume, J. Gridded global datasets for Gross Domestic Product and Human Development Index over 1990–2015. Sci Data 5, 180004 (2018) doi:10.1038/sdata.2018.4
Naturgefahrenrisiko
Relative risk out of 10
| Gefahr | Risk Level |
|---|---|
| Drought | Low (2) |
| Cyclone | High (8) |
* Risk, particularly concerning flood or landslide, may not be for the entire area.
Quellen:
- Dilley, M., R.S. Chen, U. Deichmann, A.L. Lerner-Lam, M. Arnold, J. Agwe, P. Buys, O. Kjekstad, B. Lyon, and G. Yetman. 2005. Natural Disaster Hotspots: A Global Risk Analysis. Washington, D.C.: World Bank. https://doi.org/10.1596/0-8213-5930-4.
- Center for Hazards and Risk Research - CHRR - Columbia University, Center for International Earth Science Information Network - CIESIN - Columbia University, International Bank for Reconstruction and Development - The World Bank, and United Nations Environment Programme Global Resource Information Database Geneva - UNEP/GRID-Geneva. 2005. Global Cyclone Hazard Frequency and Distribution. Palisades, NY: NASA Socioeconomic Data and Applications Center (SEDAC). https://doi.org/10.7927/H4CZ353K.
- Center for Hazards and Risk Research - CHRR - Columbia University, Center for International Earth Science Information Network - CIESIN - Columbia University, and International Research Institute for Climate and Society - IRI - Columbia University. 2005. Global Drought Hazard Frequency and Distribution. Palisades, NY: NASA Socioeconomic Data and Applications Center (SEDAC). https://doi.org/10.7927/H4VX0DFT.
Aktuelle Erdbeben in der Nähe
Magnitude 3.0 und höher
| Datum▼ | Zeit↕ | Magnitude↕ | Distance↕ | Tiefe↕ | Standort↕ | Verknüpfung |
|---|---|---|---|---|---|---|
| 7/16/19 | 9:55 PM | 4.1 | 35.3 km | 10,000 m | 15km E of Pamandzi, Mayotte | usgs.gov |
| 7/5/19 | 4:59 PM | 4.4 | 40.9 km | 10,000 m | 21km ESE of Pamandzi, Mayotte | usgs.gov |
| 6/18/19 | 4:57 PM | 4.5 | 35.8 km | 10,000 m | 16km ESE of Pamandzi, Mayotte | usgs.gov |
| 6/16/19 | 7:31 AM | 4.6 | 34.4 km | 10,000 m | 14km E of Pamandzi, Mayotte | usgs.gov |
| 5/25/19 | 1:08 PM | 4.6 | 37 km | 10,000 m | 17km E of Pamandzi, Mayotte | usgs.gov |
| 5/23/19 | 1:13 AM | 4.4 | 29.5 km | 10,000 m | 10km ESE of Pamandzi, Mayotte | usgs.gov |
| 5/14/19 | 12:20 AM | 5 | 38.5 km | 10,000 m | 19km ESE of Pamandzi, Mayotte | usgs.gov |
| 5/3/19 | 7:18 AM | 4.8 | 35.3 km | 10,000 m | 15km ESE of Pamandzi, Mayotte | usgs.gov |
| 5/2/19 | 1:13 AM | 4.4 | 29.2 km | 10,000 m | 12km SSE of Bandrele, Mayotte | usgs.gov |
| 4/25/19 | 5:33 AM | 4.3 | 41.3 km | 10,000 m | 22km ESE of Pamandzi, Mayotte | usgs.gov |
Quelle: U.S. Geological Survey (USGS)
Tsingoni
Tsingoni ist eine Gemeinde mit 10.454 Einwohnern (Stand 21. August 2012) im französischen Überseegebiet Mayotte.
Tsingoni Wikipedia-Seite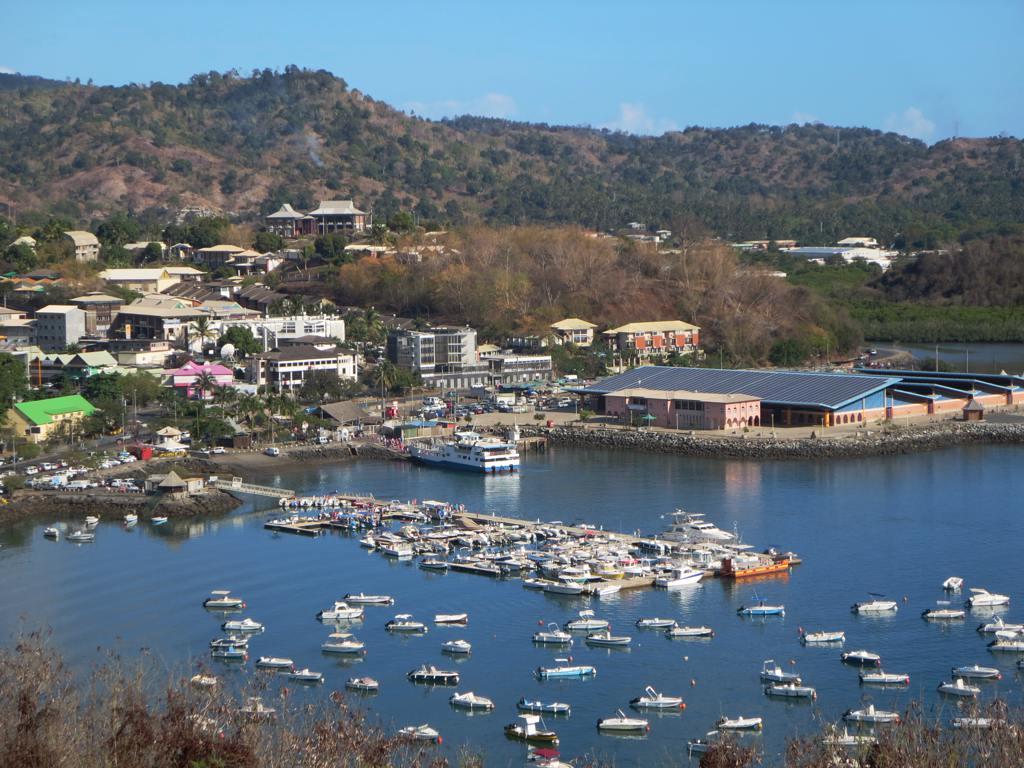
Über unsere Daten
Die Daten auf dieser Seite werden anhand verschiedener öffentlich zugänglicher Werkzeuge und Quellen geschätzt. Sie werden ohne Gewähr bereitgestellt und können Ungenauigkeiten enthalten. Nutzung auf eigene Gefahr.