Branchen
Unternehmensverteilung nach Branche in Kareedouw
| Branchenbeschreibung | Anzahl der Betriebe | Durchschnittliche Google-Bewertung |
|---|---|---|
| Erziehung und Unterricht | 20 | 3.6 |
| Vorschulen und Kindergärten | 17 | 3.8 |
| Grundschulen | 16 | 3.8 |
Kareedouw Facts
| Gebiet | 2.1 km² |
| Bevölkerung | 3.506 |
| Männliche Bevölkerung | 1.723 (49.2%) |
| Weibliche Bevölkerung | 1.783 (50.8%) |
| Population change (1975 to 2020) | +170.7% |
| Population change (2000 to 2020) | +32.0% |
| Mittleres Alter | 27.6 years (Male: 27.8, Female: 27.4) |
| Stadtviertel | Kareedouw, Joubertina, New Rest, Nompumelelo, Tsitsikamma |
| Zeit vor Ort | |
| Zeitzone | Südafrikanische Zeit |
| Geogr. Länge & Breite | -33.95280, 24.29053 |
Karte von Kareedouw
Interaktive Karte
Bevölkerung von Kareedouw
Jahre 1975 bis 2020
| Data | 1975 | 1990 | 2000 | 2015 | 2020 |
|---|---|---|---|---|---|
| Bevölkerung | 1.295 | 2.103 | 2.656 | 3.405 | 3.506 |
| Bevölkerungsdichte | 609,4 / km² | 989,6 / km² | 1.249,9 / km² | 1.602,4 / km² | 1.649,9 / km² |
Bevölkerungsänderung in Kareedouw von 2000 bis 2015
Anstieg um 28.2 % von 2000 bis 2015
| Standort | Änderung seit 1975 | Änderung seit 1990 | Änderung seit 2000 |
|---|---|---|---|
| Kareedouw | +162.9% | +61.9% | +28.2% |
| Ostkap | +46.2% | +15.9% | +4.1% |
| Südafrika | +111.9% | +48.1% | +21.4% |
Medianalter von Kareedouw
Medianalter: 27.6 Jahre
| Standort | Mittleres Alter | Durchschnittsalter (weiblich) | Durchschnittsalter (männlich) |
|---|---|---|---|
| Kareedouw | 27.6 yrs | 27.4 yrs | 27.8 yrs |
| Ostkap | 23.1 yrs | 25 yrs | 21.2 yrs |
| Südafrika | 25.4 yrs | 26.3 yrs | 24.5 yrs |
Bevölkerungsdichte von Kareedouw
Bevölkerungsdichte: 1.650 / km²
| Standort | Bevölkerung | Gebiet | Dichte |
|---|---|---|---|
| Kareedouw | 3.506 | 2,125 km² | 1.650 / km² |
| Ostkap | 6,6 million | 168.966 km² | 39 / km² |
| Südafrika | 54,3 million | 1.219.846,5 km² | 44,5 / km² |
Historische und prognostizierte Bevölkerung von Kareedouw
Geschätzte Bevölkerung von 1880 bis 2100
- JRC (Gemeinsame Forschungsstelle der Europäischen Kommission) arbeitet an GHS built-up grid
- CIESIN (Center for International Earth Science Information Network)
- [Verknüpfung] Klein Goldewijk, K., Beusen, A., Doelman, J., and Stehfest, E.: Anthropogenic land use estimates for the Holocene – HYDE 3.2, Earth Syst. Sci. Data, 9, 927–953, https://doi.org/10.5194/essd-9-927-2017, 2017.
Stadtteile in Kareedouw
Prozentsatz der Unternehmen nach Stadtteil in Kareedouw
Vorwahlen
Prozentuale Vorwahlen, die von Unternehmen in Kareedouw verwendet werden
Postleitzahlen
Prozentsatz der Unternehmen nach Postleitzahl in Kareedouw
Price Distribution
Geschäftsverteilung nach Preis für Kareedouw
Human Development Index (HDI)
Statistischer zusammengesetzter Index der Lebenserwartung, der Bildung und des Pro-Kopf-Einkommens.
CO2-Emissionen von Kareedouw
Kohlendioxid (CO2) -Emissionen pro Kopf in Tonnen pro Jahr
| Standort | CO2-Emissionen | CO2-Emissionen pro Kopf | Intensität der CO2-Emissionen |
|---|---|---|---|
| Kareedouw | 23,897 tn | 6.82 tn | 11,245.5 tons/km² |
| Ostkap | 38,642,171 tn | 5.86 tn | 228.7 tons/km² |
| Südafrika | 358,473,408 tn | 6.6 tn | 293.9 tons/km² |
| CO2-Emissionen 2013 (Tonnen/Jahr) | 23,897 tn |
| CO2-Emissionen 2013 (Tonnen/Jahr) pro Kopf | 6.82 tn |
| CO2-Emissionsintensität 2013 (Tonnen/km²/Jahr) | 11,245.5 tons/km² |
Naturgefahrenrisiko
Relative risk out of 10
| Gefahr | Risk Level |
|---|---|
| Drought | High (9) |
| Earthquake | Low (2) |
* Risk, particularly concerning flood or landslide, may not be for the entire area.
- Dilley, M., R.S. Chen, U. Deichmann, A.L. Lerner-Lam, M. Arnold, J. Agwe, P. Buys, O. Kjekstad, B. Lyon, and G. Yetman. 2005. Natural Disaster Hotspots: A Global Risk Analysis. Washington, D.C.: World Bank. https://doi.org/10.1596/0-8213-5930-4.
- Center for Hazards and Risk Research - CHRR - Columbia University, Center for International Earth Science Information Network - CIESIN - Columbia University, and International Research Institute for Climate and Society - IRI - Columbia University. 2005. Global Drought Hazard Frequency and Distribution. Palisades, NY: NASA Socioeconomic Data and Applications Center (SEDAC). https://doi.org/10.7927/H4VX0DFT.
- Center for Hazards and Risk Research - CHRR - Columbia University, Center for International Earth Science Information Network - CIESIN - Columbia University. 2005. Global Earthquake Hazard Distribution - Peak Ground Acceleration. Palisades, NY: NASA Socioeconomic Data and Applications Center (SEDAC). https://doi.org/10.7927/H4BZ63ZS.
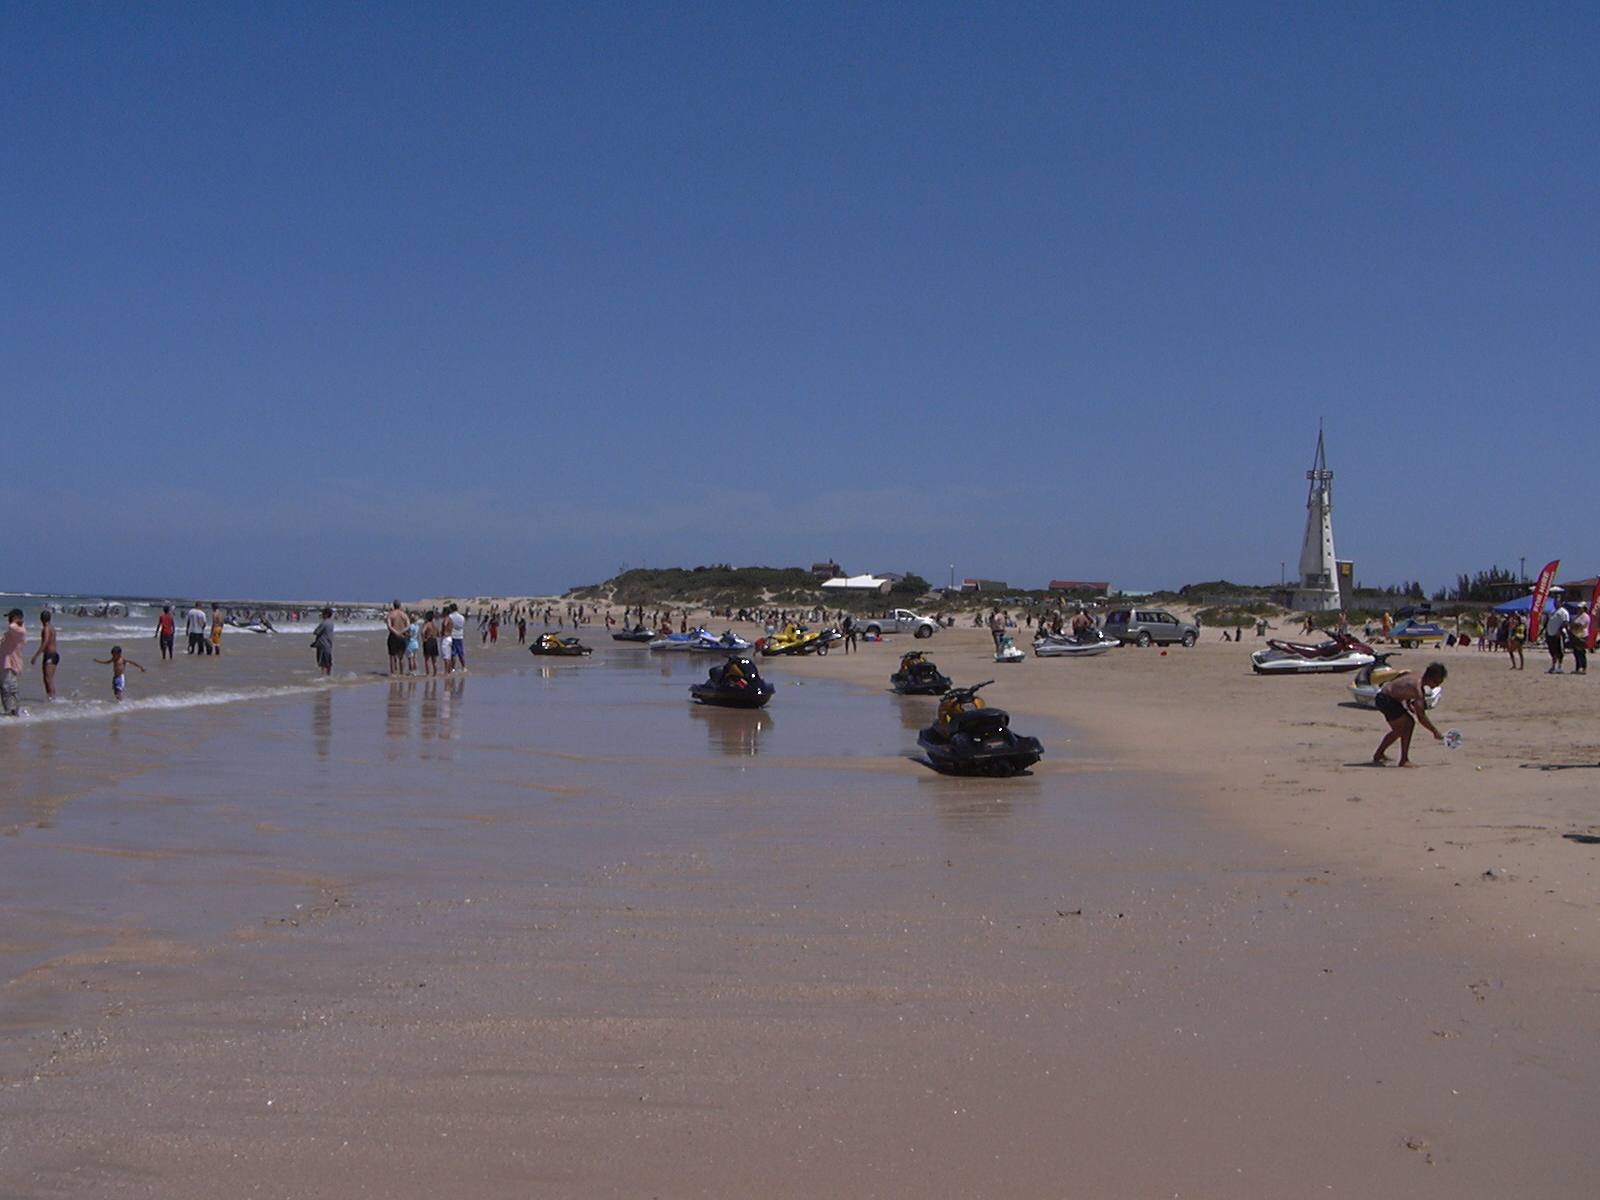
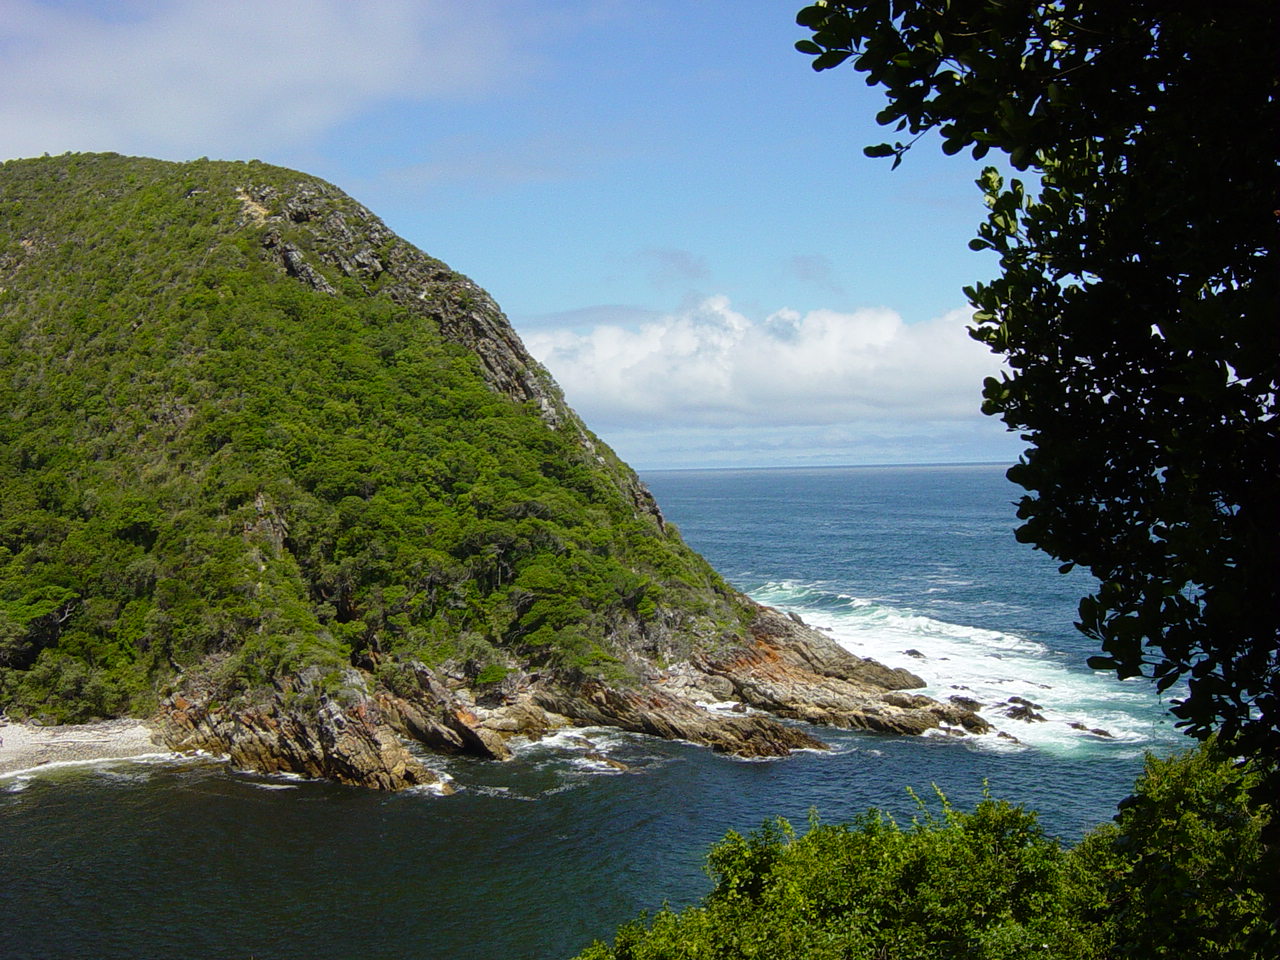
Kareedouw
Kareedouw ist eine Kleinstadt mit 4.985 Einwohnern (Stand: 2011) in der Gemeinde Kou-Kamma, Distrikt Cacadu, Provinz Ostkap in Südafrika. Die Stadt liegt auf 300 Metern Höhe zwischen dem Tsitsikamma National Park und der Baviaanskloof Mega-Reserve an der Route..
Kareedouw Wikipedia-Seite

Über unsere Daten
Die Daten auf dieser Seite werden anhand verschiedener öffentlich zugänglicher Werkzeuge und Quellen geschätzt. Sie werden ohne Gewähr bereitgestellt und können Ungenauigkeiten enthalten. Nutzung auf eigene Gefahr.