Kategorien in Maninjau
Branchen
Unternehmensverteilung nach Branche in Maninjau
| Branchenbeschreibung | Anzahl der Betriebe |
|---|---|
| Religion | 25 |
| Erziehung und Unterricht | 11 |
Maninjau Facts
| Gebiet | 37.4 km² |
| Bevölkerung | 8.519 |
| Männliche Bevölkerung | 4.179 (49.0%) |
| Weibliche Bevölkerung | 4.340 (51.0%) |
| Population change (1975 to 2020) | +58.8% |
| Population change (2000 to 2020) | +9.0% |
| Mittleres Alter | 26.8 years (Male: 25.4, Female: 28.2) |
| Vorwahlen | 75 |
| Stadtviertel | Maninjau, Tanjung Raya, Danau Maninjao, Tanjung Raya, Maninjau, Banuhampu, Maninjau, Matur, Parik Panjang, Matur |
| Zeit vor Ort | |
| Zeitzone | Westindonesische Zeit |
| Geogr. Länge & Breite | -0.30059, 100.22671 |
| Postleitzahlen | 26471 |
Karte von Maninjau
Interaktive Karte
Bevölkerung von Maninjau
Jahre 1975 bis 2020
| Data | 1975 | 1990 | 2000 | 2015 | 2020 |
|---|---|---|---|---|---|
| Bevölkerung | 5.364 | 7.158 | 7.819 | 8.401 | 8.519 |
| Bevölkerungsdichte | 143,5 / km² | 191,5 / km² | 209,2 / km² | 224,8 / km² | 227,9 / km² |
Bevölkerungsänderung in Maninjau von 2000 bis 2015
Anstieg um 7.4 % von 2000 bis 2015
| Standort | Änderung seit 1975 | Änderung seit 1990 | Änderung seit 2000 |
|---|---|---|---|
| Maninjau | +56.6% | +17.4% | +7.4% |
| Sumatera Barat | +41.3% | +6.7% | +3.3% |
| Indonesien | +96.9% | +41.9% | +21.7% |
Medianalter von Maninjau
Medianalter: 26.8 Jahre
| Standort | Mittleres Alter | Durchschnittsalter (weiblich) | Durchschnittsalter (männlich) |
|---|---|---|---|
| Maninjau | 26.8 yrs | 28.2 yrs | 25.4 yrs |
| Sumatera Barat | 26.8 yrs | 28.2 yrs | 25.4 yrs |
| Indonesien | 27.2 yrs | 27.5 yrs | 26.9 yrs |
Bevölkerungsdichte von Maninjau
Bevölkerungsdichte: 228 / km²
| Standort | Bevölkerung | Gebiet | Dichte |
|---|---|---|---|
| Maninjau | 8.519 | 37,4 km² | 228 / km² |
| Sumatera Barat | 21.004 | 50,2 km² | 419 / km² |
| Indonesien | 252,8 million | 1.893.657,8 km² | 134 / km² |
Historische und prognostizierte Bevölkerung von Maninjau
Geschätzte Bevölkerung von 0 bis 2100
- JRC (Gemeinsame Forschungsstelle der Europäischen Kommission) arbeitet an GHS built-up grid
- CIESIN (Center for International Earth Science Information Network)
- [Verknüpfung] Klein Goldewijk, K., Beusen, A., Doelman, J., and Stehfest, E.: Anthropogenic land use estimates for the Holocene – HYDE 3.2, Earth Syst. Sci. Data, 9, 927–953, https://doi.org/10.5194/essd-9-927-2017, 2017.
Stadtteile in Maninjau
Prozentsatz der Unternehmen nach Stadtteil in Maninjau
Vorwahlen
Prozentuale Vorwahlen, die von Unternehmen in Maninjau verwendet werden
Postleitzahlen
Prozentsatz der Unternehmen nach Postleitzahl in Maninjau
Price Distribution
Geschäftsverteilung nach Preis für Maninjau
Human Development Index (HDI)
Statistischer zusammengesetzter Index der Lebenserwartung, der Bildung und des Pro-Kopf-Einkommens.
CO2-Emissionen von Maninjau
Kohlendioxid (CO2) -Emissionen pro Kopf in Tonnen pro Jahr
| Standort | CO2-Emissionen | CO2-Emissionen pro Kopf | Intensität der CO2-Emissionen |
|---|---|---|---|
| Maninjau | 18,316 tn | 2.15 tn | 490.1 tons/km² |
| Sumatera Barat | 39,808 tn | 1.9 tn | 793.7 tons/km² |
| Indonesien | 478,610,416 tn | 1.89 tn | 252.7 tons/km² |
| CO2-Emissionen 2013 (Tonnen/Jahr) | 18,316 tn |
| CO2-Emissionen 2013 (Tonnen/Jahr) pro Kopf | 2.15 tn |
| CO2-Emissionsintensität 2013 (Tonnen/km²/Jahr) | 490.1 tons/km² |
Naturgefahrenrisiko
Relatives Risiko von 10
| Gefahr | Risikostufe |
|---|---|
| Dürre | Niedrig (2) |
| Flut | Mittel (4) |
| Erdbeben | Mittel (6.2) |
| Erdrutsch | Hoch (9) |
| Vulkan | Hoch (10) |
* Das Risiko, insbesondere in Bezug auf Überschwemmungen oder Erdrutsche, gilt möglicherweise nicht für das gesamte Gebiet.
- Dilley, M., R.S. Chen, U. Deichmann, A.L. Lerner-Lam, M. Arnold, J. Agwe, P. Buys, O. Kjekstad, B. Lyon, and G. Yetman. 2005. Natural Disaster Hotspots: A Global Risk Analysis. Washington, D.C.: World Bank. https://doi.org/10.1596/0-8213-5930-4.
- Center for Hazards and Risk Research - CHRR - Columbia University, Center for International Earth Science Information Network - CIESIN - Columbia University, and Norwegian Geotechnical Institute - NGI. 2005. Global Landslide Hazard Distribution. Palisades, NY: NASA Socioeconomic Data and Applications Center (SEDAC). https://doi.org/10.7927/H4P848VZ.
- Center for Hazards and Risk Research - CHRR - Columbia University, Center for International Earth Science Information Network - CIESIN - Columbia University, and International Research Institute for Climate and Society - IRI - Columbia University. 2005. Global Drought Hazard Frequency and Distribution. Palisades, NY: NASA Socioeconomic Data and Applications Center (SEDAC). https://doi.org/10.7927/H4VX0DFT.
- Center for Hazards and Risk Research - CHRR - Columbia University, Center for International Earth Science Information Network - CIESIN - Columbia University. 2005. Global Flood Hazard Frequency and Distribution. Palisades, NY: NASA Socioeconomic Data and Applications Center (SEDAC). https://doi.org/10.7927/H4668B3D.
- Center for Hazards and Risk Research - CHRR - Columbia University, Center for International Earth Science Information Network - CIESIN - Columbia University. 2005. Global Volcano Hazard Frequency and Distribution. Palisades, NY: NASA Socioeconomic Data and Applications Center (SEDAC). https://doi.org/10.7927/H4BR8Q45.
- Center for Hazards and Risk Research - CHRR - Columbia University, Center for International Earth Science Information Network - CIESIN - Columbia University. 2005. Global Earthquake Hazard Distribution - Peak Ground Acceleration. Palisades, NY: NASA Socioeconomic Data and Applications Center (SEDAC). https://doi.org/10.7927/H4BZ63ZS.
Aktuelle Erdbeben in der Nähe
Magnitude 3.0 und höher
| Datum▼ | Zeit↕ | Magnitude↕ | Distance↕ | Tiefe↕ | Standort↕ | Verknüpfung |
|---|---|---|---|---|---|---|
| 7/24/19 | 3:01 PM | 4 | 52.7 km | 100,640 m | 11km SSW of Lubukalung, Indonesia | usgs.gov |
| 6/4/19 | 7:18 AM | 4.6 | 57.5 km | 96,990 m | 10km WNW of Tabing, Indonesia | usgs.gov |
| 3/19/19 | 6:17 PM | 4.3 | 20.6 km | 61,430 m | 4km ESE of Kotatua, Indonesia | usgs.gov |
| 12/23/18 | 2:03 PM | 5 | 58.4 km | 98,030 m | 23km WSW of Tiku, Indonesia | usgs.gov |
| 8/19/18 | 4:22 AM | 5.2 | 66.6 km | 81,100 m | 37km SSW of Tiku, Indonesia | usgs.gov |
| 7/10/16 | 9:31 AM | 5.1 | 39.7 km | 8,070 m | 16km WNW of Bonjol, Indonesia | usgs.gov |
| 4/22/16 | 9:56 AM | 4.2 | 39.9 km | 170,300 m | 17km ENE of Bonjol, Indonesia | usgs.gov |
| 10/20/15 | 11:57 PM | 4.3 | 62.6 km | 95,890 m | 4km WSW of Talawi, Indonesia | usgs.gov |
| 7/25/15 | 1:17 PM | 3.7 | 48.4 km | 10,000 m | 6km SW of Saruaso, Indonesia | usgs.gov |
| 1/12/15 | 1:45 AM | 4.3 | 63.5 km | 104,070 m | 25km SSW of Pauhambar, Indonesia | usgs.gov |
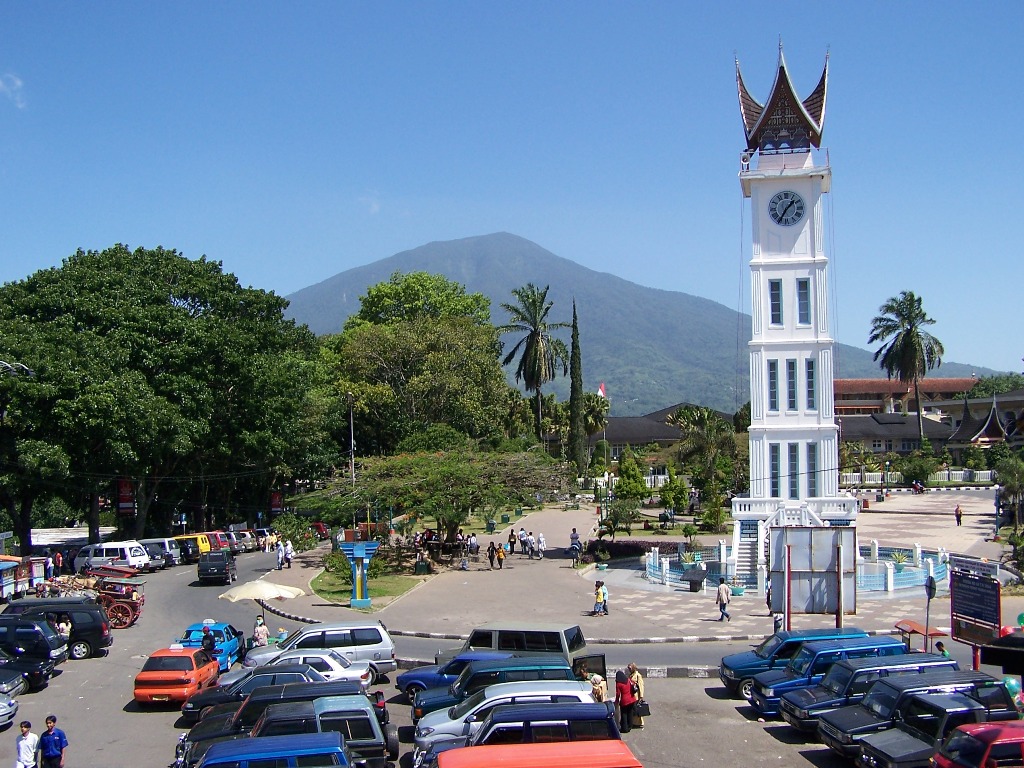
Maninjau-See
Der Maninjau-See (indones. Danau Maninjau) ist ein Kratersee auf der indonesischen Insel Sumatra. Er liegt ca. 30 km westlich von Bukittinggi. See befindet sich in einem vulkanischen Einbruchkessel - einer Caldera - dessen Kraterrand 600 m über dem See-Niveau..
Maninjau-See Wikipedia-Seite


Über unsere Daten
Die Daten auf dieser Seite werden anhand verschiedener öffentlich zugänglicher Werkzeuge und Quellen geschätzt. Sie werden ohne Gewähr bereitgestellt und können Ungenauigkeiten enthalten. Nutzung auf eigene Gefahr.