Kategorien in Akashi
Branchen
Unternehmensverteilung nach Branche in Akashi
| Branchenbeschreibung | Anzahl der Betriebe |
|---|---|
| Restaurants | 945 |
| Wohnungen | 666 |
| Einkaufen | 555 |
| Hochbau | 398 |
| Friseure | 366 |
| Unternehmensleitung | 359 |
| Öffentliche Parkanlagen | 336 |
| Immobilien | 329 |
| Erziehung und Unterricht | 309 |
| Gesundheit und Medizin | 305 |
| Japanische Restaurants | 274 |
| Schönheitssalon | 268 |
| Apotheken und Drogerien | 254 |
| Religion | 253 |
| Cafés | 251 |
| Alle Lebensmittel und Getränke | 224 |
| Lebensmittelläden und Supermärkte | 202 |
| Öffentliche Verwaltung | 195 |
Akashi Facts
| Gebiet | 3.0 km² |
| Bevölkerung | 13.784 |
| Männliche Bevölkerung | 6.700 (48.6%) |
| Weibliche Bevölkerung | 7.084 (51.4%) |
| Population change (1975 to 2020) | +13.1% |
| Population change (2000 to 2020) | -4.3% |
| Mittleres Alter | 44 years (Male: 42.9, Female: 45.2) |
| Vorwahlen | 78 |
| Stadtviertel | Okubocho Okubo, Uozumicho Shimizu, Futamicho Higashifutami, Oakashicho, 1 Chome, Honmachi, 1 Chome |
| Zeit vor Ort | |
| Zeitzone | Japanische Normalzeit |
| Geogr. Länge & Breite | 34.63333, 134.98333 |
| Postleitzahlen | 650, 672, 673, 675, 676 |
Karte von Akashi
Interaktive Karte
Bevölkerung von Akashi
Jahre 1975 bis 2030
| Data | 1975 | 1990 | 2000 | 2015 | 2020 | 2025* | 2030* |
|---|---|---|---|---|---|---|---|
| Bevölkerung | 12.189 | 13.479 | 14.410 | 14.535 | 13.784 | 13.932 | 13.968 |
| Bevölkerungsdichte | 4.063 / km² | 4.493 / km² | 4.803,3 / km² | 4.845 / km² | 4.594,7 / km² | 4.644 / km² | 4.656 / km² |
Bevölkerungsänderung in Akashi von 2000 bis 2020
Rückgang um 4.3 % von 2000 bis 2020
| Standort | Änderung seit 1975 | Änderung seit 1990 | Änderung seit 2000 |
|---|---|---|---|
| Akashi | +13.1% | +2.3% | -4.3% |
| Präfektur Hyōgo | — | — | — |
| Japan | — | — | — |
Medianalter von Akashi
Medianalter: 44 Jahre
| Standort | Mittleres Alter | Durchschnittsalter (weiblich) | Durchschnittsalter (männlich) |
|---|---|---|---|
| Akashi | 44 yrs | 45.2 yrs | 42.9 yrs |
| Präfektur Hyōgo | 45 yrs | 46.5 yrs | 43.6 yrs |
| Japan | 45.1 yrs | 46.9 yrs | 43.5 yrs |
Bevölkerungsdichte von Akashi
Bevölkerungsdichte: 4.595 / km²
| Standort | Bevölkerung | Gebiet | Dichte |
|---|---|---|---|
| Akashi | 13.784 | 3 km² | 4.595 / km² |
| Präfektur Hyōgo | 5,4 million | 8.396,6 km² | 645 / km² |
| Japan | 122,9 million | 373.410,9 km² | 329 / km² |
Historische und prognostizierte Bevölkerung von Akashi
Geschätzte Bevölkerung von 1400 bis 2100
- JRC (Gemeinsame Forschungsstelle der Europäischen Kommission) arbeitet an GHS built-up grid
- CIESIN (Center for International Earth Science Information Network)
- [Verknüpfung] Klein Goldewijk, K., Beusen, A., Doelman, J., and Stehfest, E.: Anthropogenic land use estimates for the Holocene – HYDE 3.2, Earth Syst. Sci. Data, 9, 927–953, https://doi.org/10.5194/essd-9-927-2017, 2017.
Stadtteile in Akashi
Prozentsatz der Unternehmen nach Stadtteil in Akashi
Postleitzahlen
Prozentsatz der Unternehmen nach Postleitzahl in Akashi
Price Distribution
Geschäftsverteilung nach Preis für Akashi
Human Development Index (HDI)
Statistischer zusammengesetzter Index der Lebenserwartung, der Bildung und des Pro-Kopf-Einkommens.
CO2-Emissionen von Akashi
Kohlendioxid (CO2) -Emissionen pro Kopf in Tonnen pro Jahr
| Standort | CO2-Emissionen | CO2-Emissionen pro Kopf | Intensität der CO2-Emissionen |
|---|---|---|---|
| Akashi | 57,361 tn | 4.16 tn | 19,120.4 tons/km² |
| Präfektur Hyōgo | 5,432,186 tn | 1 tn | 647 tons/km² |
| Japan | 541,995,101 tn | 4.41 tn | 1,451.5 tons/km² |
| CO2-Emissionen 2013 (Tonnen/Jahr) | 57,361 tn |
| CO2-Emissionen 2013 (Tonnen/Jahr) pro Kopf | 4.16 tn |
| CO2-Emissionsintensität 2013 (Tonnen/km²/Jahr) | 19,120.4 tons/km² |
Naturgefahrenrisiko
Relatives Risiko von 10
| Gefahr | Risikostufe |
|---|---|
| Flut | Mittel (4) |
| Erdbeben | Mittel (7) |
| Zyklon | Hoch (10) |
| Erdrutsch | Mittel (6) |
* Das Risiko, insbesondere in Bezug auf Überschwemmungen oder Erdrutsche, gilt möglicherweise nicht für das gesamte Gebiet.
- Dilley, M., R.S. Chen, U. Deichmann, A.L. Lerner-Lam, M. Arnold, J. Agwe, P. Buys, O. Kjekstad, B. Lyon, and G. Yetman. 2005. Natural Disaster Hotspots: A Global Risk Analysis. Washington, D.C.: World Bank. https://doi.org/10.1596/0-8213-5930-4.
- Center for Hazards and Risk Research - CHRR - Columbia University, Center for International Earth Science Information Network - CIESIN - Columbia University, and Norwegian Geotechnical Institute - NGI. 2005. Global Landslide Hazard Distribution. Palisades, NY: NASA Socioeconomic Data and Applications Center (SEDAC). https://doi.org/10.7927/H4P848VZ.
- Center for Hazards and Risk Research - CHRR - Columbia University, Center for International Earth Science Information Network - CIESIN - Columbia University, International Bank for Reconstruction and Development - The World Bank, and United Nations Environment Programme Global Resource Information Database Geneva - UNEP/GRID-Geneva. 2005. Global Cyclone Hazard Frequency and Distribution. Palisades, NY: NASA Socioeconomic Data and Applications Center (SEDAC). https://doi.org/10.7927/H4CZ353K.
- Center for Hazards and Risk Research - CHRR - Columbia University, Center for International Earth Science Information Network - CIESIN - Columbia University. 2005. Global Flood Hazard Frequency and Distribution. Palisades, NY: NASA Socioeconomic Data and Applications Center (SEDAC). https://doi.org/10.7927/H4668B3D.
- Center for Hazards and Risk Research - CHRR - Columbia University, Center for International Earth Science Information Network - CIESIN - Columbia University. 2005. Global Earthquake Hazard Distribution - Peak Ground Acceleration. Palisades, NY: NASA Socioeconomic Data and Applications Center (SEDAC). https://doi.org/10.7927/H4BZ63ZS.
Aktuelle Erdbeben in der Nähe
Magnitude 3.0 und höher
| Datum▼ | Zeit↕ | Magnitude↕ | Distance↕ | Tiefe↕ | Standort↕ | Verknüpfung |
|---|---|---|---|---|---|---|
| 6/18/18 | 3:31 PM | 4.6 | 59.9 km | 10,000 m | 2km NNW of Neyagawa, Japan | usgs.gov |
| 11/17/14 | 9:07 PM | 4.3 | 9 km | 14,540 m | 8km ESE of Akashi, Japan | usgs.gov |
| 8/25/14 | 6:42 PM | 4.6 | 31.5 km | 27,590 m | 2km E of Sumoto, Japan | usgs.gov |
| 8/5/14 | 4:17 PM | 4.4 | 64.9 km | 26,690 m | 4km W of Kameoka, Japan | usgs.gov |
| 12/30/13 | 6:15 AM | 4.1 | 38.9 km | 411,140 m | 6km S of Sumoto, Japan | usgs.gov |
| 11/20/13 | 1:57 AM | 4.2 | 37.5 km | 36,680 m | 9km NNE of Himeji, Japan | usgs.gov |
| 7/17/13 | 3:07 AM | 4.4 | 4.6 km | 59,400 m | near the south coast of western Honshu, Japan | usgs.gov |
| 4/12/13 | 8:33 PM | 5.8 | 32.6 km | 14,000 m | 6km WNW of Sumoto, Japan | usgs.gov |
| 7/30/11 | 1:07 AM | 4.2 | 71.4 km | 42,100 m | near the south coast of western Honshu, Japan | usgs.gov |
| 7/5/11 | 10:18 AM | 5 | 72.9 km | 16,300 m | near the south coast of western Honshu, Japan | usgs.gov |
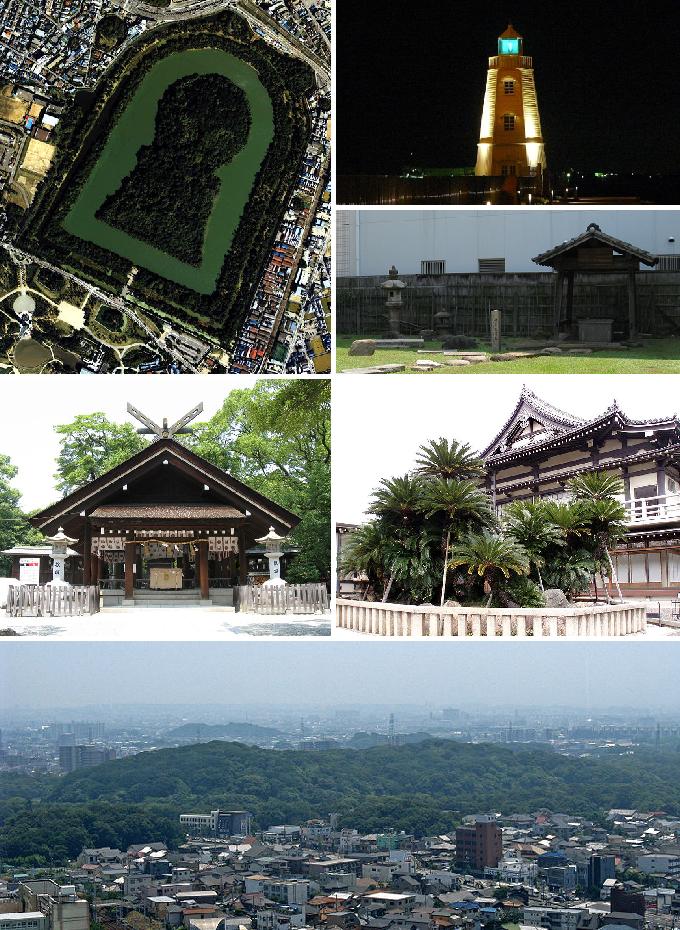
Akashi
Akashi (jap. 明石市, -shi) ist eine alte Burgstadt an der Südküste der Präfektur Hyōgo auf Honshū, der Hauptinsel von Japan. Die Stadt schließt an den Westen Kōbes an. ist in ganz Kansai für seinen frischen Fisch bekannt.
Akashi Wikipedia-Seite
Über unsere Daten
Die Daten auf dieser Seite werden anhand verschiedener öffentlich zugänglicher Werkzeuge und Quellen geschätzt. Sie werden ohne Gewähr bereitgestellt und können Ungenauigkeiten enthalten. Nutzung auf eigene Gefahr.