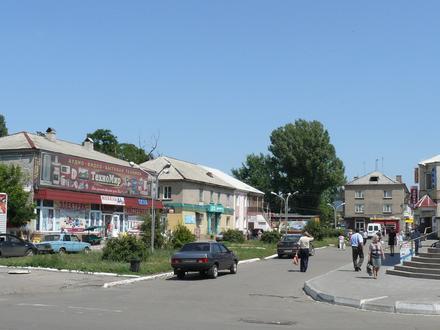
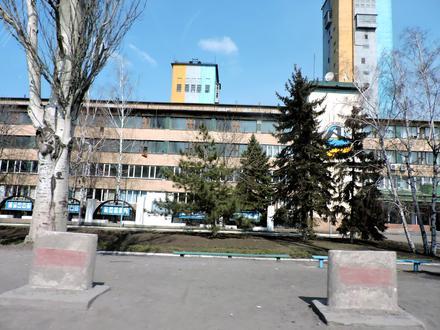
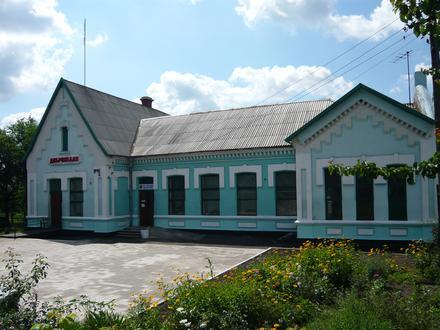
Unternehmen in Mezhova
Hotels & Reisen
Restaurants
Automobil
Finanzdienstleistungen
Medizinisch
Schönheit & Wellness
Gemeinde & Regierung
Branchen
Geschäftsverteilung nach Branchen Einkaufen: 21,6 %
Organisationsberatung: 10,4 %
Essen: 9,7 %
Branche: 7,4 %
Hausdienste: 6,3 %
Gemeinde & Regierung: 5,6 %
Finanzdienstleistungen: 5,2 %
Automobil: 4,8 %
Sport & Freizeit: 4,8 %
Sonstige: 24,2 %
| Bereich von Mezhova, Oblast Dnipropetrowsk | 2,366 km² |
| Bevölkerung | 3.239 |
| Bevölkerungsänderung von 1975 bis 2015 | -35,4 % |
| Bevölkerungsänderung von 2000 bis 2015 | -19,1 % |
| Vorwahlen | 5630, 5670 |
| Zeit vor Ort | Sonntag 07:58 |
| Zeitzone | Osteuropäische Sommerzeit |
| Geogr. Länge & Breite | 48.25318° / 36.73468° |
| Postleitzahlen | 52900, 52901, 52918, 52936 |
Mezhova, Oblast Dnipropetrowsk - Karte
Mezhova, Oblast Dnipropetrowsk Bevölkerung
Jahr 1975 bis 2015| Daten | 1975 | 1990 | 2000 | 2015 |
|---|---|---|---|---|
| Bevölkerung | 5.013 | 4.678 | 4.002 | 3.239 |
| Bevölkerungsdichte | 2.118 / km² | 1.977 / km² | 1.691 / km² | 1.369 / km² |
Mezhova Bevölkerungsänderung von 2000 bis 2015
Abnahme von 19,1 % ab Jahr 2000 bis 2015| Standort | Änderung seit 1975 | Änderung seit 1990 | Änderung seit 2000 |
|---|---|---|---|
| Mezhova, Oblast Dnipropetrowsk | -35,4 % | -30,8 % | -19,1 % |
| Dnipropetrovs'k | -10,3 % | -14,5 % | -9,3 % |
| Ukraine | -8,6 % | -13,1 % | -8,3 % |
Mezhova, Oblast Dnipropetrowsk Bevölkerungsdichte
Bevölkerungsdichte: 1.369 / km²| Standort | Bevölkerung | Gebiet | Bevölkerungsdichte |
|---|---|---|---|
| Mezhova, Oblast Dnipropetrowsk | 3.239 | 2,366 km² | 1.369 / km² |
| Dnipropetrovs'k | 3,3 Millionen | 31.905 km² | 102,0 / km² |
| Ukraine | 42,3 Millionen | 574.117,9 km² | 73,8 / km² |
Mezhova, Oblast Dnipropetrowsk Projizierte Bevölkerung
Geschätzte Bevölkerung von 1975 bis 2100Sources:
1. JRC (European Commission's Joint Research Centre) work on the GHS built-up grid
2. CIESIN (Center for International Earth Science Information Network)
3. [Verknüpfung] Klein Goldewijk, K., Beusen, A., Doelman, J., and Stehfest, E.: Anthropogenic land use estimates for the Holocene – HYDE 3.2, Earth Syst. Sci. Data, 9, 927–953, https://doi.org/10.5194/essd-9-927-2017, 2017.
Human Development Index (HDI)
Statistischer zusammengesetzter Index der Lebenserwartung, der Bildung und des Pro-Kopf-Einkommens.Sources: [Link] Kummu, M., Taka, M. & Guillaume, J. Gridded global datasets for Gross Domestic Product and Human Development Index over 1990–2015. Sci Data 5, 180004 (2018) doi:10.1038/sdata.2018.4
Mezhova, Oblast Dnipropetrowsk CO2-Emissionen
Kohlendioxid (CO2) -Emissionen pro Kopf in Tonnen pro Jahr| Standort | CO2-Emissionen | CO2-Emissionen pro Kopf | Intensität der CO2-Emissionen |
|---|---|---|---|
| Mezhova, Oblast Dnipropetrowsk | 17.143 tn. sh. | 5,29 tn. sh. | 7.246 tn. sh./km² |
| Dnipropetrovs'k | 17.310.498 tn. sh. | 5,32 tn. sh. | 542,6 tn. sh./km² |
| Ukraine | 197.794.395 tn. sh. | 4,67 tn. sh. | 344,5 tn. sh./km² |
Mezhova, Oblast Dnipropetrowsk CO2-Emissionen
| 2013 CO2-Emissionen (Tonnen/Jahr) | 17.143 tn. sh. |
| 2013 CO2-Emissionen (Tonnen/Jahr) pro Kopf | 5,29 tn. sh. |
| 2013 Intensität der CO2-Emissionen (Tonnen/km²/Jahr) | 7.246 tn. sh./km² |
Postleitzahlen
Prozentsatz der Unternehmen nach Postleitzahlen in Mezhova Postleitzahl 52900: 73,7 %
Postleitzahl 52901: 23,7 %
Postleitzahl 52700: 2,6 %

Über unsere Daten
Die Daten auf dieser Seite werden mithilfe einer Reihe öffentlich verfügbarer Tools und Ressourcen geschätzt. Es wird ohne Gewähr geliefert und kann Ungenauigkeiten enthalten. Benutzung auf eigene Gefahr. Sehen Sie hier für weitere Informationen.